SLIDE 1 - 1 -
Toyota Tsusho Corporation Financial Highlights for the Fiscal Year Ended March 31, 2020 [IFRS basis](Consolidated)
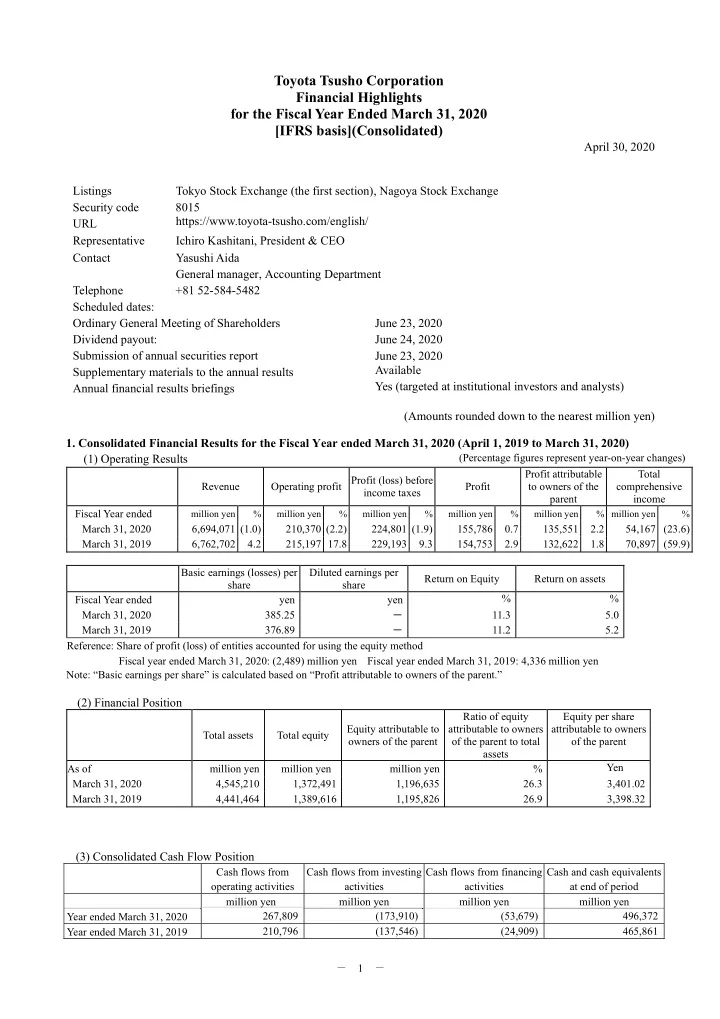
April 30, 2020 (Amounts rounded down to the nearest million yen)
- 1. Consolidated Financial Results for the Fiscal Year ended March 31, 2020 (April 1, 2019 to March 31, 2020)
(1) Operating Results
(Percentage figures represent year-on-year changes) Revenue Operating profit Profit (loss) before income taxes Profit Profit attributable to owners of the parent Total comprehensive income Fiscal Year ended
million yen % million yen % million yen % million yen % million yen % million yen %
March 31, 2020 6,694,071 (1.0) 210,370 (2.2) 224,801 (1.9) 155,786 0.7 135,551 2.2 54,167 (23.6) March 31, 2019 6,762,702 4.2 215,197 17.8 229,193 9.3 154,753 2.9 132,622 1.8 70,897 (59.9) Basic earnings (losses) per share Diluted earnings per share Return on Equity Return on assets Fiscal Year ended yen yen % % March 31, 2020 385.25 - 11.3 5.0 March 31, 2019 376.89 - 11.2 5.2 Reference: Share of profit (loss) of entities accounted for using the equity method Fiscal year ended March 31, 2020: (2,489) million yen Fiscal year ended March 31, 2019: 4,336 million yen Note: “Basic earnings per share” is calculated based on “Profit attributable to owners of the parent.”
(2) Financial Position
Total assets Total equity Equity attributable to
Ratio of equity attributable to owners
assets Equity per share attributable to owners
As of million yen million yen million yen % Yen March 31, 2020 4,545,210 1,372,491 1,196,635 26.3 3,401.02 March 31, 2019 4,441,464 1,389,616 1,195,826 26.9 3,398.32
(3) Consolidated Cash Flow Position
Cash flows from
Cash flows from investing activities Cash flows from financing activities Cash and cash equivalents at end of period million yen million yen million yen million yen Year ended March 31, 2020 267,809 (173,910) (53,679) 496,372 Year ended March 31, 2019 210,796 (137,546) (24,909) 465,861
Listings Tokyo Stock Exchange (the first section), Nagoya Stock Exchange Security code 8015 URL https://www.toyota-tsusho.com/english/ Representative Ichiro Kashitani, President & CEO Contact Yasushi Aida General manager, Accounting Department Telephone +81 52-584-5482 Scheduled dates: Ordinary General Meeting of Shareholders June 23, 2020 Dividend payout: June 24, 2020 Submission of annual securities report June 23, 2020 Supplementary materials to the annual results Available Annual financial results briefings Yes (targeted at institutional investors and analysts)
SLIDE 2 - 2 -
Record date or period Dividend per share Total dividends paid (total) Dividend payout ratio (consolidated) Ratio of dividends to equity attributable to
company (consolidated) End-first quarter End-second quarter End-third quarter Fiscal year- end Annual total yen yen yen yen yen million yen % % Year ended March 31, 2019 - 50.00 - 50.00 100.00 35,210 26.5 3.0 Year ended March 31, 2020 - 60.00 - 50.00 110.00 38,726 28.6 3.2 Year ending March 31, 2021 (forecast) - - - - - - Note: Dividends for the fiscal year ending March 31, 2021 have not yet been determined given that it is difficult to reasonably estimate the earnings for the term. For more information, see “Dividends” on page 6.
- 3. Forecast of Consolidated Earnings for the Fiscal Year ending March 31, 2021 (April 1, 2020 to March 31, 2021)
(Percentage figures represent year-on-year changes) Profit attributable to owners of the parent Basic earnings per share million yen % yen Full year
- - -
Note: Earnings forecasts for the fiscal year ending March 31, 2021 have not yet been determined given that it is difficult to reasonably estimate the earnings for the term. The reasons for this are provided in “(1) Overview of Operating Performance” on page 4.
*Notes (1) Changes affecting the consolidation status of significant subsidiaries (changes in specified subsidiary resulting in change in scope of consolidations) during the period: Yes Newly consolidated: one (Name) Toyota Tsusho Thai Holdings Co., Ltd. (2) Changes in accounting policy and changes in accounting estimates: 1) Changes in accounting policy required by IFRS: Yes 2) Changes other than the above 1): None 3) Changes in accounting estimates: None Note: For details, please refer to (Changes in Accounting Policy) on page 15. (3) Number of issued shares (common stock) 1) Number of issued shares at end of period (Treasury shares included): March 31, 2020: 354,056,516 shares March 31, 2019: 354,056,516 shares 2) Number of shares held in treasury at end of period: March 31, 2020: 2,210,565 shares March 31, 2019: 2,169,311 shares 3) Average Number of shares outstanding during the period: Year ended March 31, 2020: 351,856,020 shares Year ended March 31, 2019: 351,885,732 shares (Reference) Non-consolidated Financial Results Fiscal Year ended March 31, 2020 (April 1, 2019 to March 31, 2020) (1) Non-consolidated Operating Results
(Percentage figures represent year-on-year changes) Revenue Operating profit Ordinary income Profit Fiscal Year ended
million yen %
million yen % million yen % million yen
%
March 31, 2020 2,939,577 (16.9) (3,335) - 116,764 35.4 109,772 87.1 March 31, 2019 3,535,670 (7.4) (7,986) - 86,235 3.1 58,684 (17.4) Earnings per share Earnings per share, fully diluted Fiscal Year ended yen yen March 31, 2020 311.79 - March 31, 2019 166.67 -
SLIDE 3 - 3 -
(2) Non-consolidated Financial Position
Total assets Net assets Equity ratio Net assets per share As of million yen million yen % Yen March 31, 2020 2,176,958 609,695 28.0 1,731.80 March 31, 2019 2,186,983 559,453 25.6 1,588.90 Total equity: As of March 31, 2020: 609,695 million yen As of March 31, 2019: 559,453 million yen
*Audit Status This report is exempt from the audit by certified public accountant or audit firm. *Appropriate use of earnings forecasts and other important information
- 1. The above forecasts, which constitute forward-looking statements, are based on information available to the Company
as of the date of the release of this document. Actual results may differ materially from the above forecasts due to a range of factors.
- 2. The Company is scheduled to hold an annual earnings briefing for institutional investors and analysts on Friday, May
1, 2020. The presentation materials for the earnings briefing will be posted on its website promptly following the earnings announcement.
*This is an abridged translation of the original Japanese document and is provided for informational purposes only. If there are any discrepancies between this and the original, the original Japanese document prevails.
SLIDE 4 - 4 -
- 1. Consolidated Results of Operations
(1) Overview of Operating Performance (1) Business Environment In the fiscal year ended March 31, 2020, the global economy as a whole trended toward slower growth because of factors including economic slumps in Europe and China, despite resilience in the U.S. economy through the third
- quarter. In the fourth quarter, economic activity worldwide stalled due to the impact of the novel coronavirus
spreading from country to country. Through the third quarter, in the U.S. economy the employment environment and personal consumption were strong, and the Federal Reserve Board’s interest rate cuts and other financial policies underpinned business
- conditions. In the European economy, although personal consumption and government consumption remained firm
and signs of bottoming out in the manufacturing industry following a prolonged slump appeared, a sense of uncertainty about the future grew stronger in response to Brexit and other factors. The Chinese economy continued to slow in the wake of stagnant infrastructure investment and deterioration in consumer sentiment, despite government efforts to bolster the economy with tax cuts, subsidies, and other financial policies. Emerging market economies continued to decelerate, largely as a result of sharp declines in exports and resource prices in response to China’s economic slowdown. In the fourth quarter, a global economic slowdown trend gained impetus accompanying factors including suspension of economic activity and turmoil in financial markets in countries around the world due to the impact of the novel coronavirus outbreak. Against this backdrop, the Japanese economy slowed, reflecting cooling of domestic demand following a series
- f natural disasters and the effects of the consumption tax increase, despite improvement in the employment and
income environments. Also, the economy went into recession as inbound tourism demand continued to decline and exports remained weak in the wake of the novel coronavirus outbreak, business sentiment worsened in manufacturing and other sectors of the economy, and consumer sentiment cooled further. 2) Business Activities by Segment (I) Metals For the purpose of assisting with commercialization of AST coil technology, an innovative technology that helps boost the performance of electric motors, a key component of electric vehicles, in June 2019 Toyota Tsusho Corporation acquired an equity stake in ASTER Co., Ltd., owner of the technology, through a third-party share allocation. (II) Global Parts & Logistics To enter the expanding civilian aircraft MRO (maintenance, repair, and overhaul) market, in November 2019 Toyota Tsusho Corporation entered into a sales representation agreement with A J Walter Aviation Limited, a U.K.-based company engaged in the business of maintenance, repair, and overhaul (MRO) of parts for aircraft bodies and engines, and is pursuing business cooperation. (III) Automotive To promote mobility services in emerging nations and business development in the field of MaaS, in December 2019 Toyota Tsusho Corporation invested in a Series A funding round from WhereIsMyTransport Ltd., a U.K.- based company that engages in the public transportation data platform business in emerging nations, and has entered into a business alliance and is pursuing cooperation with WhereIsMyTransport. (IV) Machinery, Energy & Projects In December 2019, Toyota Tsusho Corporation, in a consortium with Bolloré Africa Logistics and Nippon Yusen Kabushiki Kaisha, signed an agreement with the General Authority for the Suez Canal Economic Zone to set up and operate Egypt’s first dedicated automotive terminal at East Port Said. (V) Chemicals & Electronics For the purpose of promoting technology R&D toward realization of connected services, in November 2019 Toyota Tsusho Corporation, together with Toyota Tsusho Asia Pacific Pte. Ltd. and TOYOTA TSUSHO NEXTY ELECTRONICS (THAILAND) CO., LTD., established Toyota Tsusho Mobility Informatics Pte. Ltd. in
- Singapore. The new company began operations in December.
(VI) Food & Consumer Services In response to the popularity of the Axia I and Axia II serviced apartments for singles and business travelers in Indonesia, PT. Toyota Tsusho Real Estate Cikarang, which develops and operates serviced apartments for families, began construction of Axia III in December 2019 in order to meet further demand from the growing number of Japanese expatriates in Indonesia. (VII) Africa For the purpose of utilizing the services of Sendy Limited, which provides digital logistics platform services in Kenya and elsewhere in eastern Africa, in December 2019 Toyota Tsusho Corporation decided to invest in Sendy through Mobility 54 Investment SAS, which will subscribe to a third-party allotment of Series B shares.
SLIDE 5 - 5 -
3) Revenue, Profits and Total Assets (Unit: billions of yen) Year ended March 31, 2019 Year ended March 31, 2020 Change Revenue 6,762.7 6,694.0 (68.7) Gross profit 638.4 639.8 1.4 Operating profit 215.1 210.3 (4.8) Profit (attributable to owners of the parent) 132.6 135.5 2.9 Total assets 4,441.4 4,545.2 103.8 4) Operating Results The Toyota Tsusho Group's consolidated revenue for the fiscal year ended March 31, 2020 decreased 68.7 billion yen (1.0%) year on year to 6,694.0 billion yen, largely as a result of a decrease in the trading volume of crude oil and the foreign exchange impact of yen appreciation. Consolidated operating profit decreased 4.8 billion yen (2.2%) year on year to 210.3 billion yen due to an increase in selling, general and administrative expenses, which offset an increase in gross profit. Consolidated profit for the year (attributable to owners of the parent) increased 2.9 billion yen (2.2%) year on year to a fourth consecutive annual all-time record of 135.5 billion yen, largely as a result of a decrease in income tax expense, which offset a decrease in operating profit and deterioration of share of profit (loss) of investments accounted for using the equity method. Segment Information (I) Metals Profit for the year (attributable to owners of the parent) decreased 16.4 billion yen (46.2%) year on year to 18.9 billion yen, largely as a result of a decrease in trading volume of automobile production-related products, a decline in metal prices, and impairment losses in the metal resources business. (II) Global Parts & Logistics Profit for the year (attributable to owners of the parent) decreased 1.4 billion yen (5.9%) year on year to 22.3 billion yen, largely due to a decrease in dividend income and the effect of currency translation. (III) Automotive Profit for the year (attributable to owners of the parent) decreased 3.0 billion yen (13.0%) year on year to 19.7 billion yen, largely as a result of a decrease in sales volume at overseas auto dealerships. (IV) Machinery, Energy & Projects Profit for the year (attributable to owners of the parent) increased 16.4 billion yen (87.4%) year on year to 35.1 billion yen, boosted largely by a gain on sale of shares in an affiliate in the electric power business and the impact
- f a one-time loss in the previous fiscal year.
(V) Chemicals & Electronics Profit for the year (attributable to owners of the parent) increased 4.3 billion yen (23.3%) year on year to 22.7 billion yen, largely due to the impact of a one-time loss in the previous fiscal year, which offset profit margin shrinkage in the electronics business. (VI) Food & Consumer Services Profit for the year (attributable to owners of the parent) increased 4.1 billion yen (234.1%) year on year to 5.8 billion yen, largely as a result of profitability improvement in the food business and an increase in high-margin business. (VII) Africa Profit for the year (attributable to owners of the parent) increased 3.9 billion yen (38.5%) year on year to 14.0 billion yen, largely as a result of growth in automobile sales volume. Outlook for Fiscal Year Ending March 31, 2021 At this time it would be difficult to reasonably calculate the impact of the novel coronavirus outbreak on the Toyota Tsusho Group. Accordingly, the Company has not yet determined a forecast for the fiscal year ending March 31, 2021.
SLIDE 6 - 6 -
(2) Consolidated Financial Condition At March 31, 2020, consolidated assets totaled 4,545.2 billion yen, a 103.8 billion yen increase from March 31,
- 2019. The increase is attributable in part to a 168.3 billion yen increase in property, plant and equipment.
Consolidated equity at March 31, 2020, totaled 1,372.4 billion yen, a 17.2 billion yen decrease from March 31,
- 2019. The decrease is attributable in part to a 90.1 billion yen decrease in other components of equity and a 17.9
billion yen decrease in non-controlling interests, which offset a 92.3 billion increase in retained earnings accruing from consolidated profit for the year (attributable to owners of the parent). The Group consequently ended the fiscal year with a ratio of equity attributable to owners of the parent to total assets (equity ratio) of 26.3% and a net debt/equity ratio of 0.9. (3) Cash Flows Cash and cash equivalents (“cash”) at March 31, 2020, totaled 496.3 billion yen, a 30.5 billion yen increase from March 31, 2019. The increase, which was 8.1 billion yen smaller than the previous fiscal year’s increase in cash, is attributable to positive cash flow from operating activities, partially offset by negative cash flows from investing and financing activities. The main factors affecting cash flows are as follows. Cash flows from operating activities Net cash provided by operating activities was 267.8 billion yen, consisting mainly of profit before income taxes. Cash provided increased by 57.1 billion yen from the previous fiscal year, mainly as a result of a 63.1 billion yen decrease in the size of the increase in inventories. Cash flows from investing activities Net cash used by investing activities was 173.9 billion yen, mainly for the purchase of property, plant and
- equipment. Cash used increased by 36.4 billion yen from the previous fiscal year, mainly as a result of a 48.8
billion decrease in cash due to payment into time deposits. As a result, free cash flow was a positive 93.9 billion yen, an increase of 26.1 billion yen from the previous fiscal year. Cash flows from financing activities Net cash used in financing activities was 53.6 billion yen, consisting mainly of dividends paid. Cash used increased by 28.7 billion yen from the previous fiscal year, mainly because of a 24.7 billion yen decrease in cash due to payments for acquisition of subsidiaries' interest from non-controlling interests. Dividends The Company's dividend policy is to endeavor to maintain a stable dividend and increase its dividend per share, with a consolidated dividend payout ratio of 25% or more. For the fiscal year ended March 31, 2020, the Company plans to pay a year-end dividend of 50 yen per share. Including the previously paid interim dividend of 60 yen per share, dividends for the fiscal year ended March 31, 2020, will total 110 yen per share, an increase of 10 yen per share from the previous fiscal year. At this time it would be difficult to prepare an earnings forecast. Accordingly, the Company has not yet determined a forecast for dividends. The Company intends to use internally retained earnings to further enhance and strengthen its operational foundation and invest in business expansion to ensure future shareholder returns. To enable the Company to flexibly distribute earnings to shareholders in the future, its Articles of Incorporation authorize it to distribute retained earnings and/or additional paid-in capital to shareholders pursuant to a Board of Directors’ resolution in accordance with Article 459(1) of the Companies Act. For the time being, however, the Company plans to continue paying dividends twice a year as usual.
- 2. Basic Approach to Selection of Accounting Standards
The Group has voluntarily adopted International Financial Reporting Standards (IFRS), to enhance its financial information’s international comparability in capital markets
SLIDE 7 - 7 -
- 3. Consolidated Financial Statements
(1) Consolidated Statements of Financial Position (Unit: Millions of yen) As of March 31, 2019
As of March 31, 2020
Assets Current assets Cash and cash equivalents 465,861 496,372 Trade and other receivables 1,397,937 1,252,145 Other financial assets 60,525 147,467 Inventories 745,157 783,606 Other current assets 133,764 135,430 Subtotal 2,803,246 2,815,021 Assets held for sale - 3,271 Total current assets 2,803,246 2,818,293 Non-current assets Investments accounted for using the equity method 285,074 265,643 Other investments 454,647 388,342 Trade and other receivables 27,264 33,841 Other financial assets 40,796 31,787 Property, plant and equipment 612,587 780,826 Intangible assets 157,278 161,107 Investment property 18,628 19,202 Deferred tax assets 15,973 19,443 Other non-current assets 25,967 26,720 Total non-current assets 1,638,217 1,726,917 Total assets 4,441,464 4,545,210
SLIDE 8
- 8 -
(Unit: Millions of yen) As of March 31, 2019 As of March 31, 2020 Liabilities and equity Liabilities Current liabilities: Trade and other payables 1,199,839 1,140,522 Bonds and borrowings 509,924 502,985 Other financial liabilities 15,679 42,597 Income taxes payable 24,627 22,764 Provisions 6,224 6,351 Other current liabilities 133,762 163,057 Total current liabilities 1,890,057 1,878,280 Non-current liabilities: Bonds and borrowings 993,122 1,020,322 Trade and other payables 2,302 87,241 Other financial liabilities 20,964 27,907 Retirement benefits liabilities 41,752 41,970 Provisions 26,208 41,045 Deferred tax liabilities 63,661 47,081 Other non-current liabilities 13,779 28,869 Total non-current liabilities 1,161,790 1,294,438 Total liabilities 3,051,847 3,172,719 Equity Share capital 64,936 64,936 Capital surplus 150,933 149,807 Treasury shares (3,596) (3,735) Other components of equity 50,394 (39,802) Retained earnings 933,159 1,025,429 Total equity attributable to owners of the parent 1,195,826 1,196,635 Non-controlling interests 193,789 175,856 Total equity 1,389,616 1,372,491 Total liabilities and equity 4,441,464 4,545,210
SLIDE 9
- 9 -
(2) Consolidated Statements of Profit or Loss and Comprehensive Income Consolidated Statements of Profit or Loss (Unit: Millions of yen) Year ended March 31, 2019 Year ended March 31, 2020 Revenue Sales of goods
6,668,113
6,578,920 Sales of services and others
94,588
115,150 Total revenue
6,762,702
6,694,071 Cost of sales
(6,124,273)
(6,054,186) Gross profit
638,428
639,885 Selling, general and administrative expenses
(420,657)
(430,164) Other income (expenses) Gain (loss) on sale and disposals of non-current assets, net
401
1,662 Impairment losses on non-current assets
(4,521)
(1,478) Other, net
1,546
465 Total other income (expenses)
(2,573)
649 Operating profit
215,197
210,370 Finance income (costs) Interest income
10,943
13,180 Interest expenses
(27,033)
(29,880) Dividend income
24,024
18,530 Other, net
1,724
15,089 Total finance income (costs)
9,658
16,920 Share of profit (loss) of investments accounted for using the equity method
4,336
(2,489) Profit before income taxes
229,193
224,801 Income tax expense
(74,440)
(69,014) Profit for the year
154,753
155,786 Profit for the year attributable to: Owners of the parent
132,622
135,551 Non-controlling interests
22,130
20,234 Earnings per share attributable to owners of the parent Basic earnings per share (yen)
376.89
385.25 Diluted earnings per share (yen)
-
-
SLIDE 10 - 10 -
Consolidated Statements of Comprehensive Income (Unit: Millions of yen) Year ended March 31, 2019 Year ended March 31, 2020 Profit for the year
154,753
155,786 Other comprehensive income Items that will not be reclassified to profit or loss: Remeasurements of defined benefit pension plans
(1,699)
(770) Financial assets measured at fair value through
- ther comprehensive income
(55,377)
(46,006) Share of other comprehensive income of investments accounted for using the equity method
(1,317)
(1,125) Items that may be reclassified to profit or loss: Cash flow hedges
2,396
(507) Exchange differences on translation of foreign
(24,637)
(52,805) Share of other comprehensive income of investments accounted for using the equity method
(3,220)
(403) Other comprehensive income for the year, net of tax
(83,855)
(101,618) Total comprehensive income for the year
70,897
54,167 Total comprehensive income for the year attributable to: Owners of the parent
51,862
41,297 Non-controlling interests
19,034
12,870
SLIDE 11 - 11 -
(3) Consolidated Statement of Changes in Equity Year ended March 31, 2019 (April 1, 2018 to March 31, 2019)
(Unit: Millions of yen) Total equity attributable to owners of the parent Share capital Capital surplus Treasury shares Other components of equity Remeasurements of defined benefit pension plans Financial assets measured at FVTOCI* Cash flow hedges Exchange differences
- n translation of foreign
- perations
Total Balance at the beginning of the year 64,936 150,921 (3,578) - 248,425 (12,961) (105,520) 129,943 Profit for the year Other comprehensive income Remeasurements of defined benefit pension plans (1,671) (1,671) Financial assets measured at FVTOCI* (55,504) (55,504) Cash flow hedges 2,734 2,734 Exchange differences on translation of foreign
(26,318) (26,318) Total comprehensive income for the year - - - (1,671) (55,504) 2,734 (26,318) (80,760) Dividends Acquisition (disposal) of treasury shares (18) Acquisition (disposal) of non-controlling interests 11 Reclassification to retained earnings 1,671 (460) 1,210 Other Transactions with owners - 11 (18) 1,671 (460) - - 1,210 Balance at the end of the year 64,936 150,933 (3,596) - 192,460 (10,226) (131,839) 50,394 Total equity attributable to owners of the parent Non-controlling interests Total equity Retained earnings Total Balance at the beginning
832,495 1,174,718 187,468 1,362,187 Profit for the year 132,622 132,622 22,130 154,753 Other comprehensive income Remeasurements of defined benefit pension plans (1,671) (36) (1,707) Financial assets measured at FVTOCI* (55,504) (1,181) (56,686) Cash flow hedges 2,734 (124) 2,610 Exchange differences on translation of foreign
(26,318) (1,753) (28,071) Total comprehensive income for the year 132,622 51,862 19,034 70,897 Dividends (34,858) (34,858) (14,480) (49,339) Acquisition (disposal) of treasury shares (18) (18) Acquisition (disposal) of non-controlling interests 11 1,750 1,762 Reclassification to retained earnings (1,210) - - Other 4,110 4,110 16 4,127 Transactions with owners (31,958) (30,754) (12,713) (43,468) Balance at the end of the year 933,159 1,195,826 193,789 1,389,616 * “Financial assets measured at FVTOCI” represents “Financial assets measured at fair Value through Other Comprehensive Income.”
SLIDE 12 - 12 -
Year ended March 31, 2020 (April 1, 2019 to March 31, 2020)
(Unit: Millions of yen) Total equity attributable to owners of the parent Share capital Capital surplus Treasury shares Other components of equity Remeasurements of defined benefit pension plans Financial assets measured at FVTOCI* Cash flow hedges Exchange differences on translation of foreign
Total Balance at the beginning of the year 64,936 150,933 (3,596) - 192,460 (10,226) (131,839) 50,394 Profit for the year Other comprehensive income Remeasurements of defined benefit pension plans (896) (896) Financial assets measured at FVTOCI* (46,828) (46,828) Cash flow hedges 3,783 3,783 Exchange differences on translation of foreign
(50,312) (50,312) Total comprehensive income for the year - - - (896) (46,828) 3,783 (50,312) (94,254) Dividends Acquisition (disposal) of treasury shares (138) Acquisition (disposal) of non-controlling interests (1,127) Reclassification to retained earnings 896 3,160 4,057 Other Transactions with owners - (1,126) (138) 896 3,160 - - 4,057 Balance at the end of the year 64,936 149,807 (3,735) - 148,792 (6,443) (182,151) (39,802) Total equity attributable to owners of the parent Non-controlling interests Total equity Retained earnings Total Balance at the beginning
933,159 1,195,826 193,789 1,389,616 Profit for the year 135,551 135,551 20,234 155,786 Other comprehensive income Remeasurements of defined benefit pension plans (896) (57) (954) Financial assets measured at FVTOCI* (46,828) (118) (46,947) Cash flow hedges 3,783 (1,968) 1,815 Exchange differences on translation of foreign
(50,312) (5,219) (55,531) Total comprehensive income for the year 135,551 41,297 12,870 54,167 Dividends (38,728) (38,728) (12,028) (50,757) Acquisition (disposal) of treasury shares (137) (137) Acquisition (disposal) of non-controlling interests (1,127) (18,756) (19,884) Reclassification to retained earnings (4,057) - - Other (494) (494) (18) (513) Transactions with owners (43,281) (40,488) (30,804) (71,292) Balance at the end of the year 1,025,429 1,196,635 175,856 1,372,491 * “Financial assets measured at FVTOCI” represents “Financial assets measured at fair Value through Other Comprehensive Income.”
SLIDE 13
- 13 -
(4) Consolidated Statements of Cash Flows (Unit: Millions of yen) Year ended March 31, 2019 Year ended March 31, 2020 Cash flows from operating activities Profit before income taxes 229,193 224,801 Depreciation and amortization 76,005 103,558 Impairment losses on non-current assets 4,521 1,478 Finance costs (income) (9,658) (16,920) Share of (profit) loss of investments accounted for using the equity method (4,336) 2,489 (Gain) loss on sale and disposals of non-current assets, net (401) (1,662) (Increase) decrease in trade and other receivables (52,505) 124,267 (Increase) decrease in inventories (94,824) (31,792) Increase (decrease) in trade and other payables 100,756 (99,377) Other (5,438) 17,818 Subtotal 243,312 324,661 Interest received 10,365 12,640 Dividends received 46,597 35,551 Interest paid (26,049) (30,389) Income taxes paid (63,428) (74,655) Net cash provided by operating activities 210,796 267,809 Cash flows from investing activities (Increase) decrease in time deposits (5,461) (54,282) Purchase of property, plant and equipment (86,970) (103,808) Proceeds from sale of property, plant and equipment 9,920 9,062 Purchase of intangible assets (14,197) (13,906) Proceeds from sale of intangible assets 2,067 668 Purchase of investment property - (1,578) Proceeds from sale of investment property 4,286 858 Purchase of investments (47,831) (19,445) Proceeds from sale of investment 2,235 26,086 Proceeds from (payment for) acquisition of subsidiary (6,204) (29,235) Proceeds from (payment for) sale of subsidiary 3,965 2,143 Payments of loans receivable (11,021) (7,249) Collection of loans receivable 12,522 6,211 Subsidy income - 9,849 Other (857) 717 Net cash used in investing activities (137,546) (173,910)
SLIDE 14
- 14 -
(Unit: Millions of yen) Year ended March 31, 2019 Year ended March 31, 2020 Cash flows from financing activities Net increase (decrease) in short-term borrowings (28,052) (31,715) Proceeds from long-term borrowings 156,860 113,826 Repayment of long-term borrowings (165,648) (93,684) Proceeds from issuance of bonds 66,143 53,161 Purchase of treasury shares (26) (139) Dividends paid (34,858) (38,728) Dividends paid to non-controlling interests (14,480) (12,028) Proceeds from non-controlling interests 2,575 7,061 Payments for acquisition of subsidiaries' interest from non-controlling interests (2,233) (26,951) Proceeds from sale of subsidiaries' interest to non- controlling interests 137 334 Other (5,326) (24,814) Net cash provided by (used in) financing activities (24,909) (53,679) Net increase (decrease) in cash and cash equivalents 48,340 40,219 Cash and cash equivalents at the beginning of the year 423,426 465,861 Effect of exchange rate changes on cash and cash equivalents (5,905) (9,707) Cash and cash equivalents at end of the year 465,861 496,372
SLIDE 15 - 15 -
(5) Notes on the Consolidated Financial Statements (Notes on the Going-concern Assumption) Not applicable (Changes in Accounting Policy) (Leases) Effective from the first quarter of the fiscal year ended March 31, 2020, the Group has adopted IFRS 16 Leases (published January 2016). IFRS 16 requires lessees to apply a single model of accounting to recognize all leases on the consolidated statement
- f financial position. At the commencement date of the lease, the lessee recognizes assets representing the right to
use the underlying asset (the right-of-use assets) during the lease term and the obligations relating to the lease payments (lease liabilities). Then, the lessee recognizes a depreciation charge for the right-of-use asset and interest
- n the lease liability separately.
With the adoption of IFRS 16, the following transitional measures and expedients have been applied. ・ The Group has elected a method to recognize the cumulative effect of initially applying IFRS 16 at the date
・ For leases that were entered into on or before the date of initial application, IFRS 16 is applied to the leases that were previously identified as leases applying IAS 17 “Leases” and IFRIC 4 “Determining whether an Arrangement contains a Lease.” ・ For short-term leases and low-value leases, the right-of-use assets and the lease liabilities are not recognized. ・ On initial application, hindsight is used in determining the lease term. The weighted average of the lessee’s incremental borrowing rate applied to lease liabilities recognized in the statement of consolidated financial position at the date of initial application is 2.2%. In addition, the difference between a) the total of minimum lease payments that are related to non-cancellable
- perating lease contracts and disclosed applying IAS 17 as of March 31, 2019, and b) lease liabilities recognized
- n initial application of IFRS 16, is 13,375 million yen. The amount mainly reflects the effects of reviewing the
lease term in conjunction with the application of IFRS 16. Due to this, compared with what it would have been under the previous accounting standards, at the beginning of the period, the right-of-use asset included in property, plant and equipment increased 92,878 million yen, and lease liabilities included in trade and other payables increased 93,004 million yen.
SLIDE 16 - 16 -
(Segment Information) Revenue, Profit/loss and Assets and Other Items by Reportable Segment Year ended March 31, 2019 (April 1, 2018 to March 31, 2019)
(Unit: Millions of yen) Reportable segment Metals Global Parts & Logistics Automotive Machinery, Energy & Project Chemicals & Electronics Food & Consumer Services Revenue External 1,740,139 882,551 649,146 947,586 1,499,984 454,565 Inter-segment 1,919 22,203 7,861 2,961 10,571 583 Total 1,742,058 904,755 657,007 950,547 1,510,556 455,149 Gross profit 99,898 75,369 88,730 89,872 107,531 43,922 Profit (loss) for the year attributable to owners of the parent 35,309 23,799 22,757 18,780 18,441 1,762 Segment assets 933,413 402,007 291,096 771,431 701,543 286,823 Other items (1) Investments accounted for using the equity method 49,385 17,446 23,831 80,521 65,608 28,182 (2) Share of profit (loss) of investments accounted for using the equity method 2,210 1,960 2,276 3,410 (939) (2,945) (3) Depreciation and amortization 11,532 5,794 8,482 18,510 2,956 3,612 (4) Impairment losses on non- current assets 1,334 - - 2,673 429 - (5) Capital expenditure 11,415 6,223 16,824 33,500 4,259 2,239 Reportable segment Other *1 Adjustments *2 Consolidated Africa Total Revenue External 586,124 6,760,097 2,604 - 6,762,702 Inter-segment 6,263 52,364 1,024 (53,389) - Total 592,387 6,812,462 3,628 (53,389) 6,762,702 Gross profit 137,167 642,492 2,965 (7,029) 638,428 Profit (loss) for the year attributable to owners of the parent 10,118 130,970 1,693 (41) 132,622 Segment assets 536,662 3,922,976 800,601 (282,113) 4,441,464 Other items (1) Investments accounted for using the equity method 2,403 267,379 17,694 - 285,074 (2) Share of profit (loss) of investments accounted for using the equity method (2,402) 3,571 772 (7) 4,336 (3) Depreciation and amortization 19,971 70,860 5,145 - 76,005 (4) Impairment losses on non- current assets 4,437 84 - 4,521 (5) Capital expenditure 16,147 90,610 12,354 - 102,964
Notes:
- 1. “Other” comprises businesses that are not included in reportable segments including functional services which provide
- peration support to the whole Group. In addition, this column includes profit/loss that is not classified into a specific
reportable segment.
- 2. Figures in “Adjustments” represent the amounts of inter-segment transactions.
- 3. Prices in inter-segment transactions are decided based on negotiation on an individual basis.
SLIDE 17 - 17 -
Year ended March 31, 2020 (April 1, 2019 to March 31, 2020)
(Unit: Millions of yen) Reportable segment Metals Global Parts & Logistics Automotive Machinery, Energy & Project Chemicals & Electronics Food & Consumer Services Revenue External 1,657,811 858,699 615,038 790,424 1,473,147 439,406 Inter-segment 2,127 24,721 1,165 5,902 4,037 634 Total 1,659,939 883,421 616,203 796,327 1,477,184 440,040 Gross profit 92,301 73,149 84,393 89,585 102,518 46,695 Profit (loss) for the year attributable to owners of the parent 18,996 22,389 19,798 35,192 22,742 5,888 Segment assets 893,889 388,677 279,548 816,956 668,663 279,356 Other items (1) Investments accounted for using the equity method 40,970 17,472 25,385 70,811 63,203 28,190 (2) Share of profit (loss) of investments accounted for using the equity method (8,978) 1,570 3,004 1,433 3,192 (1,530) (3) Depreciation and amortization 12,317 8,509 10,857 20,497 4,052 5,551 (4) Impairment losses on non- current assets - - - 1,012 47 - (5) Capital expenditure 27,285 12,976 15,799 59,080 7,146 11,365 Reportable segment Other *1 Adjustments *2 Consolidated Africa Total Revenue External 853,911 6,688,439 5,631 - 6,694,071 Inter-segment 51 38,640 1,786 (40,426) - Total 853,963 6,727,080 7,417 (40,426) 6,694,071 Gross profit 155,181 643,825 (913) (3,026) 639,885 Profit (loss) for the year attributable to owners of the parent 14,017 139,026 (3,476) 2 135,551 Segment assets 592,046 3,919,138 904,862 (278,790) 4,545,210 Other items (1) Investments accounted for using the equity method 1,223 247,257 18,385 - 265,643 (2) Share of profit (loss) of investments accounted for using the equity method (2,140) (3,447) 957 (2,489) (3) Depreciation and amortization 28,179 89,964 13,593 - 103,558 (4) Impairment losses on non- current assets - 1,060 417 - 1,478 (5) Capital expenditure 21,007 154,660 20,284 - 174,945
Notes:
- 1. “Other” comprises businesses that are not included in reportable segments including functional services which provide
- peration support to the whole Group. In addition, this column includes profit/loss that is not classified into a specific
reportable segment.
- 2. Figures in “Adjustments” represent the amounts of inter-segment transactions.
- 3. Prices in inter-segment transactions are decided based on negotiation on an individual basis.
- 4. Tax burden related to investment in subsidiaries and associates used to be recognized in profit for the year of each reportable
segment at the point of realization. Effective from the fiscal year ended March 31, 2020, however, the timing of recognition has been changed to the point of recognition of temporary differences. This change has little impact on the financial statements for the fiscal year ended March 31, 2019 and the fiscal year ended March 31, 2020.
SLIDE 18
- 18 -
(Per Share Information) Calculation basis for basic earnings per share attributable to owners of the parent is as follows. Diluted earnings per share (attributable to owners of the parent) is not provided herein, as there are no residual securities. Year ended March 31, 2019 Year ended March 31, 2020 Profit for the year (attributable to owners of the parent) (million yen)
132,622 135,551
Basic weighted average number of common shares (thousand shares)
351,885 351,856
Basic earnings per share (attributable to owners of the parent) (yen)
376.89 385.25
(Material Subsequent Events) Not applicable.
SLIDE 19 (For reference)
Outline of Consolidated Results
April 30, 2020
for the Fiscal Year ended March 31, 2020 (IFRS)
Toyota Tsusho Corporation (Unit: Billion yen)
×
As of March 31, 2019 As of March 31, 2020
Change over the end of the previous fiscal year
Main factors behind year-on-year changes
Amount % Amount %
Consolidated Operating Results
Year ended March 31, 2019 Year ended March 31, 2020
Year-on-year change
Main factors behind year-on-year changes Consolidated Financial Position
4,441.4 4,545.2 103.8 2.3%
Gross profit
(Current assets)
Revenue Total assets
2,803.2 2,818.2 15.0 0.5%
638.4 639.8
1.4
0.2%
6,762.7 6,694.0
(68.7)
(1.0%)
Total equity
1,389.6 1,372.4 (17.2) (1.2%)
SG&A expenses
(Non-current assets)
1,638.2 1,726.9 88.7
0.6
3.1
-
(420.6) (430.1)
(9.5)
- 5.4% Other income (expenses)
(2.5)
Share of profit of investments accounted for using the equity method
Other finance income (costs)
Consolidated Cash Flow Position
Dividend income Operating profit Net interest-bearing debt
988.4 1,032.4
Interest income (expenses)
Debt-equity ratio (times)
0.8 0.9 0.1 44.0 4.5%
Year ended March 31, 2019 Year ended March 31, 2020 Year-on- year change
1.7 15.0
13.3
-
(6.7)
Main factors behind year-on-year changes 【Cash flows from operating activities】 Profit before income taxes 【Cash flows from investing activities】
Profit for the period 1-2: Free cash flow Income tax expense
investing activities Profit before income taxes
- 1. Cash flows from
- perating activities
(74.4) (69.0)
5.4
-
229.1 224.8
(4.3)
(1.9%)
4.3 (2.4)
-
(TBD)
-
Purchase of property, plant and equipment Profit attributable to
Cash flows from financing activities
154.7 155.7
1.0
0.7%
Year ending March 31, 2021 (note)
Interim 50 yen 60 yen
% Year-on-year change
*The top row for each division indicates gross profit; the bottom row indicates profit attributable to owners of the parent.
-
Year ended March 31, 2019 Year ended March 31, 2020
Amount Year ended March 31, 2020 (results)
Total comprehensive income (attributable to owners of the parent)
Metals
Decreased largely due to decrease in dividend income and the effect of currency translation.
Metals
Decreased largely due to decrease in trading volume
- f automobile production-related products, lower
market prices, and impairment loss in the metal resources business. Decreased largely due to decrease in sales volume handled by overseas auto dealerships.
Global Parts & Logistics Automotive Global Parts & Logistics Divisions Year ended March 31, 2019 Year ended March 31, 2020
Year-on-year change
Main factors behind year-on-year changes in profit attributable to owners of parent
Consolidated Financial Results Forecasts
51.8 41.2
(10.6)
(20.4%)
(3.0)
22.3
(1.4)
(5.9%)
(2.2) Machinery, Energy & Project 155.1 5.8 Operating profit C
p
a t e Total Africa
Increased largely driven by growth in automobile sales volume. 6.3%
102.5 35.1
Food & Consumer Services Increased largely due to improved profitability of the food business and an increase in high-margin business. Chemicals & Electronics Increased largely due to the impact of one-time loss recorded in the previous fiscal year, which offset the lower profit margin of the electronics business. Machinery, Energy & Project Automotive Gross profit
46.6
Profit attributable to
5.8
4.1
Amount %
D i v i s i
s
Increased largely due to gain on sale of shares in affiliate in the electric power business and the impact of one-time loss recorded in the previous fiscal year.
Chemicals & Electronics - - - Changes in Major Indexes -
End of period
14.0 - -
Yen / Euro
Average during the year
Africa Food & Consumer Services 89.5 -
Yen / US dollar
Average during the year
End of period
- - 22.7
370 384 Profit
Corn futures (cents / bushel) Dubai oil (US dollars / bbl.)
69 60
Yen TIBOR 3M average
0.07% 0.07%
-
Interest rate
-
US dollar LIBOR 3M average
2.50% 2.04%
- - - -
Profit before income taxes
- 135.5 155.7 224.8 210.3 639.8 - - - - - - - - - - - - - -
-
Exchange rate
Year ended March 31, 2019 (as of March 31, 2019) Year ended March 31, 2020 (as of March 31, 2020)
- - -
111 109 125 120 111 109 - 128
-
121
- -
- -
(TBD)
-
(TBD)
- - - - - 28.6%
(forecast)
110 yen
(forecast)
Payout ratio (consolidated) 26.5% Full year 100 yen
-
-
- - 19.7 84.3 22.3 - - 92.3 - - - - - 73.1 18.9
Quarterly changes 1Q 2Q 3Q 4Q 154.4 163.1 163.5 52.9 55.4 46.3
(28.7) (137.5) (173.9) (36.4) 73.2 93.9 20.7 210.7 267.8 57.1
Gross profit 158.6 Operating profit 55.6 Profit attributable to
55.6
The top row for each division indicates gross profit; the bottom row indicates profit for the period attributable to owners of paren
(24.9) (53.6) 132.6 135.5 2.9
2.2%
23.5 37.4 18.9
Note: Earnings forecasts and dividends for the fiscal year ending March 31, 2021 have not yet been determined, given that it is difficult to reasonably estimate the earnings for the term.
Year ending March 31, 2021 (note)
Dividend per share -
24.0 18.5
(5.5)
-
215.1 210.3
(4.8)
(2.2%)
(16.0) (16.7)
(0.7)
-
638.4 639.8
1.4
0.2%
132.6 135.5
2.9
2.2%
137.1 155.1
18.0
13.1%
10.1 14.0
3.9
38.5%
89.8 89.5
(0.3)
88.7 84.3
(4.4)
234.1%
18.4 22.7
4.3
23.3% (4.7%) (0.3%)
18.7 35.1
16.4
87.4%
43.9 46.6
2.7
107.5 102.5
(5.0)
1.7 99.8 92.3
(7.5)
(7.6%) (4.9%)
22.7 19.7
(46.2%)
23.7
(13.0%)
35.3 18.9
(16.4)
75.3 73.1
(2.9%) 【Gross profit】 +1.4 billion yen Increased largely due to growth in automobile sales volume in the Africa Division. 【Operating profit】 -4.8 billion yen Decreased largely due to increase in SG&A expenses, which offset the increase in gross profit. 【Profit attributable to owners of the parent】 +2.9 billion yen Increased largely due to decrease in income tax expense, which offset the decrease in operating profit and deterioration of share of profit/loss of investments accounted for using the equity method. 【Total assets】 +103.8 billion yen ・Property, plant and equipment +168.3 billion yen ・Other financial assets +86.9 billion yen ・Trade and other receivables -145.8 billion yen 【Total equity】 -17.2 billion yen ・Retained earnings +92.3 billion yen ・Exchange differences on translation of foreign
- perations
- 50.3 billion yen
・Financial assets measured at FVTOCI
・Non-controlling interests