SLIDE 1 − 1 −
Toyota Tsusho Corporation Financial Highlights for the Six Months Ended September 30, 2019 [IFRS basis] (Consolidated)
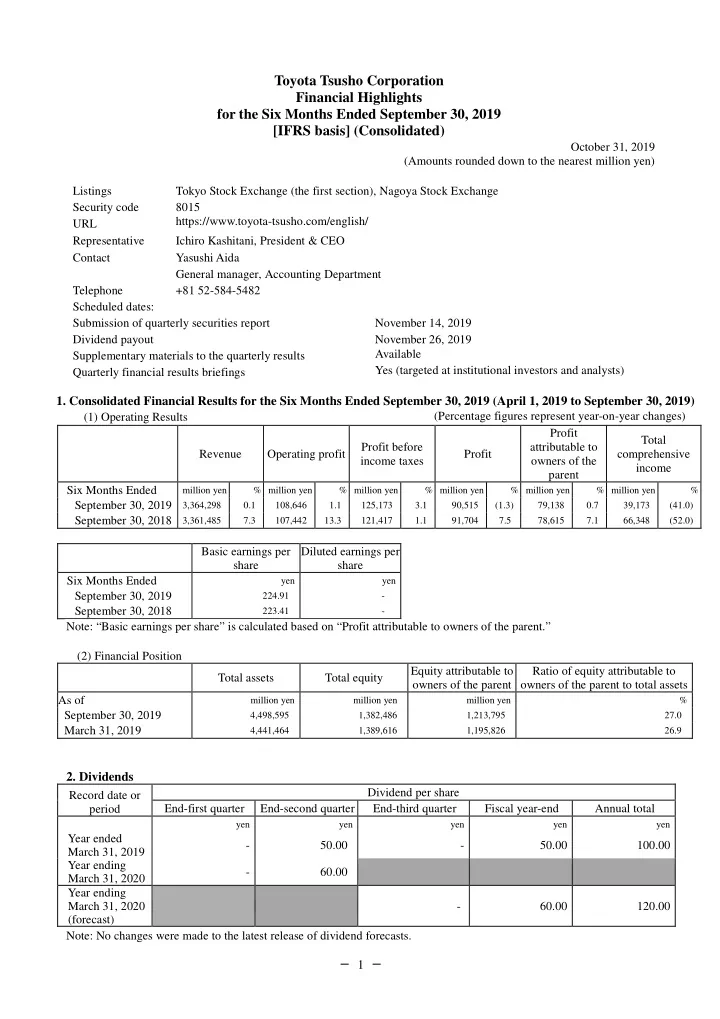
October 31, 2019 (Amounts rounded down to the nearest million yen)
- 1. Consolidated Financial Results for the Six Months Ended September 30, 2019 (April 1, 2019 to September 30, 2019)
(1) Operating Results (Percentage figures represent year-on-year changes) Revenue Operating profit Profit before income taxes Profit Profit attributable to
parent Total comprehensive income Six Months Ended
million yen % million yen % million yen % million yen % million yen % million yen %
September 30, 2019 3,364,298
0.1 108,646 1.1 125,173 3.1 90,515 (1.3) 79,138 0.7 39,173 (41.0)
September 30, 2018 3,361,485
7.3 107,442 13.3 121,417 1.1 91,704 7.5 78,615 7.1 66,348 (52.0)
Basic earnings per share Diluted earnings per share Six Months Ended
yen yen
September 30, 2019
224.91
223.41
- Note: “Basic earnings per share” is calculated based on “Profit attributable to owners of the parent.”
(2) Financial Position Total assets Total equity Equity attributable to
Ratio of equity attributable to
- wners of the parent to total assets
As of
million yen million yen million yen %
September 30, 2019
4,498,595 1,382,486 1,213,795 27.0
March 31, 2019
4,441,464 1,389,616 1,195,826 26.9
Record date or period Dividend per share End-first quarter End-second quarter End-third quarter Fiscal year-end Annual total
yen yen yen yen yen
Year ended March 31, 2019
100.00 Year ending March 31, 2020
Year ending March 31, 2020 (forecast)
120.00 Note: No changes were made to the latest release of dividend forecasts. Listings Tokyo Stock Exchange (the first section), Nagoya Stock Exchange Security code 8015 URL https://www.toyota-tsusho.com/english/ Representative Ichiro Kashitani, President & CEO Contact Yasushi Aida General manager, Accounting Department Telephone +81 52-584-5482 Scheduled dates: Submission of quarterly securities report November 14, 2019 Dividend payout November 26, 2019 Supplementary materials to the quarterly results Available Quarterly financial results briefings Yes (targeted at institutional investors and analysts)
SLIDE 2 − 2 −
- 3. Forecast of Consolidated Earnings for the Fiscal Year ending March 31, 2020 (April 1, 2019 to March 31, 2020)
(Percentage figures represent year-on-year changes) Profit attributable to owners of the parent Basic earnings per share
million yen % yen
Full year 150,000 13.1 426.27
Note: No changes were made to the latest release of earnings forecasts.
*Notes (1) Changes affecting the consolidation status of significant subsidiaries (changes in specified subsidiary resulting in change in scope of consolidations) during the period: Yes Newly consolidated: One (Name) Toyota Tsusho Thai Holdings Co., Ltd. (2) Changes in accounting policy and changes in accounting estimates: 1) Changes in accounting policy required by IFRS: Yes 2) Changes other than the above 1): None 3) Changes in accounting estimates: None Note: For details, please refer to (Changes in Accounting Policy) on page 13. (3) Number of issued shares (common stock) 1) Number of issued shares at end of period (Treasury shares included): September 30, 2019: 354,056,516 shares March 31, 2019: 354,056,516 shares 2) Number of shares held in treasury at end of period: September 30, 2019: 2,205,515 shares March 31, 2019: 2,169,311 shares 3) Average number of shares outstanding during the period: Six Months Ended September 30, 2019: 351,864,293 shares Six Months Ended September 30, 2018: 351,885,590 shares *Quarterly review status This report is exempt from the quarterly review by certified public accountant or audit firm. *Appropriate use of earnings forecasts and other important information
- 1. The above forecasts, which constitute forward-looking statements, are based on information available to the Company
as of the date of the release of this document. Actual results may differ materially from the above forecasts due to a range of factors.
- 2. The Company is scheduled to hold a quarterly earnings briefing for institutional investors and analysts on Friday,
November 1, 2019. The presentation materials for the earnings briefing will be posted on its website promptly following the earnings announcement. *This is an abridged translation of the original Japanese document and is provided for informational purposes only. If there are any discrepancies between this and the original, the original Japanese document prevails.
SLIDE 3 − 3 −
- 1. Consolidated Results of Operations
(1) Overview of Operating Performance 1) Business Environment In the first six months of the fiscal year (April 1 – September 30, 2019), the global economy as a whole trended toward slower growth because of factors including an economic slump in Europe and China, despite a robust U.S.
- economy. Escalation of the conflict between the U.S. and China led to worldwide heightening of concern about an
economic downturn. Federal Reserve Board interest rate policy underpinned business activity in the U.S., with the economy remaining on a recovery trend fueled by robust personal consumption, despite slowing of exports to China and
- ther markets attributable to declining external demand resulting from trade friction between the U.S. and China. In
the European economy, although exports are showing a recovery trend, signs of economic deceleration stemming in part from sluggish internal demand continued. The outlook for the future remained uncertain amid fraught Brexit negotiations between the UK and EU. In the Chinese economy, the trend toward economic deceleration continued in the wake of a slump in infrastructure investment and deterioration of consumer sentiment, despite attempts to prop up the economy with tax cuts, subsidies, and other measures amid economic rebalancing from investment-led to consumption-led growth resulting from a shift in China’s growth strategy from a quantitative to a qualitative
- focus. Also, slowing of economic growth came into sharp focus due to intensification of trade friction with the U.S.
Emerging market economies gradually slowed as a result of declining exports and stagnant resource prices resulting from slowing of the Chinese economy. Against this backdrop, the Japanese economy continued to gradually recover, driven by improvement in the employment and income environments, despite continuing weakness in exports and production due to declining exports to Asia partly attributable to the economic slowdown in China. Concerns about a slowdown strengthened however, in response to sluggishness in Europe, China, and other overseas economies as well as trade frictions. 2) Business Activities by Segment (I) Metals For the purpose of helping to realize an eco-friendly recycling society, in September 2019 the Group launched on a full-scale basis a demonstration project for recycling of end-of-life vehicles, which has been adopted for the New Energy and Industrial Technology Development Organization’s (NEDO) project for construction of an efficient and appropriate recycling system for end-of-life vehicles in Thailand. (II) Global Parts & Logistics The Group acquired an equity stake in Israel-based UVeye Ltd. in a private placement offering in June 2019 and is now pursuing collaboration with UVeye, which provides vehicle inspection services through visual analysis utilizing artificial intelligence (AI) for the purpose of improving efficiency and labor-saving in vehicle inspection. (III) Automotive To further establish the Toyota brand in Myanmar and contribute to the country’s economy, in June 2019 the Group acquired an equity stake in Toyota Myanmar Co., Ltd., a vehicle production company established by Toyota Motor Corporation, and began preparations for local production. (IV) Machinery, Energy & Projects For the purpose of supporting the development of local communities through community-level electrification, the Group acquired an equity stake in U.S.-based venture company Powerhive Inc. in a private placement offering in July 2019. Powerhive engages in a mini-grid business that combines solar power generation systems and storage batteries in non-electrified areas of Kenya. (V) Chemicals & Electronics For the purpose of regional development and popularization of ultra-compact electric vehicles, in July 2019 the Group launched Ha:moRIDE, a micromobility sharing service that utilizes ultra-compact “COMS” electric vehicles from Toyota Motor Corporation, as a tourism-focused MaaS business in Kumejima, Okinawa Prefecture, under the name Kumejima Ha:mo. (VI) Food & Consumer Services For the purpose of functional enhancement of a health support business that utilizes personal health data, in August 2019 the Group acquired an equity stake in, and entered into a business alliance with, M-aid Co., Ltd. On the
- ccasion of the equity investment in M-aid Co., Ltd., the Group also entered into a business alliance with Sugi
Pharmacy Co., Ltd. for the purpose of constructing a next-generation preventive medical services model. (VII) Africa For the purpose of accelerating initiatives in the mobility business in Africa, in August 2019 the Group decided to establish Mobility 54 Investment SAS, an investment company specializing in capital investments and loans to mobility-related start-ups, in partnership with CFAO SAS.
SLIDE 4 − 4 − (3) Operating Results The Toyota Tsusho Group's consolidated revenue for the six months ended September 30, 2019 increased 2.8 billion yen (0.1%) year on year to 3,364.2 billion yen, largely by virtue of growth in the Africa Division’s auto sales. Consolidated operating profit increased 1.2 billion yen (1.1%) year on year to 108.6 billion yen, largely because
- f improvement in foreign exchange gains/losses, which offset a decrease in gross profit. Consolidated profit
(attributable to owners of the parent) increased 0.5 billion yen (0.7%) year on year to 79.1 billion yen, largely as a result of a gain on sale of shares in an affiliate in the Machinery, Energy & Project Division, which offset deterioration of share of profit (loss) of investments accounted for using the equity method accompanying impairment losses in the Metals Division and Food & Consumer Services Division. Segment Information (I) Metals Profit for the period (attributable to owners of the parent) decreased 9.6 billion yen (56.2%) year on year to 7.5 billion yen, largely as a result of impairment loss in the metal resources business. (II) Global Parts & Logistics Profit for the period (attributable to owners of the parent) increased 1.1 billion yen (8.3%) year on year to 14.1 billion yen, largely as a result of increased trading volume of automotive parts. (III) Automotive Profit for the period (attributable to owners of the parent) decreased 2.3 billion yen (21.3%) year on year to 8.3 billion yen, largely as a result of deterioration of share of profit (loss) of investments accounted for using the equity method in the overseas automobile sales business. (IV) Machinery, Energy & Projects Profit for the period (attributable to owners of the parent) increased 15.7 billion yen (130.5%) year on year to 27.7 billion yen, boosted largely by a gain on sale of shares in affiliate in the electric power business. (V) Chemicals & Electronics Profit for the period (attributable to owners of the parent) decreased 1.7 billion yen (14.6%) year on year to 9.4 billion yen, largely due to profit margin shrinkage in the electronics business. (VI) Food & Consumer Services Profit for the period (attributable to owners of the parent) decreased 0.9 billion yen (36.7%) year on year to 1.7 billion yen, largely as a result of impairment loss in the food business. (VII) Africa Profit for the period (attributable to owners of the parent) increased 0.4 billion yen (6.0%) year on year to 6.8 billion yen, largely as a result of automobile sales volume growth. (2) Consolidated Financial Condition At September 30, 2019, consolidated assets totaled 4,498.5 billion yen, a 57.1 billion yen increase from March 31,
- 2019. The increase is attributable in part to a 109.1 billion yen increase in property, plant and equipment.
Consolidated equity at September 30 totaled 1,382.4 billion yen, a 7.2 billion yen decrease from March 31. The decrease is attributable in part to a 42.6 billion yen decrease in other components of equity and a decrease of 25.1 billion yen in non-controlling interests, which offset a 60.0 billion yen increase in retained earnings accruing from consolidated profit for the period (attributable to owners of the parent). (3) Outlook for Fiscal Year Ending March 31, 2020 The consolidated earnings forecast issued on April 26, 2019, remains unchanged.
SLIDE 5 − 5 −
- 2. Consolidated Financial Statements
(1) Consolidated Statement of Financial Position (Unit: Millions of yen) As of March 31, 2019 As of September 30, 2019 Assets Current assets Cash and cash equivalents 465,861 466,736
Trade and other receivables
1,397,937 1,266,254
Other financial assets
60,525 122,260
Inventories
745,157 791,256
Other current assets
133,764 134,427
Total current assets
2,803,246 2,780,936
Non-current assets
Investments accounted for using the equity method 285,074 275,198 Other investments 454,647 446,769 Trade and other receivables 27,264 25,724 Other financial assets 40,796 33,495 Property, plant and equipment 612,587 721,643 Intangible assets 157,278 155,436 Investment property 18,628 18,392 Deferred tax assets 15,973 17,433 Other non-current assets 25,967 23,564 Total non-current assets 1,638,217 1,717,659 Total assets 4,441,464 4,498,595
SLIDE 6
− 6 − (Unit: Millions of yen)
As of March 31, 2019 As of September 30, 2019 Liabilities and equity Liabilities Current liabilities Trade and other payables 1,199,839 1,139,042 Bonds and borrowings 509,924 474,784 Other financial liabilities 15,679 20,609 Income taxes payable 24,627 26,618 Provisions 6,224 5,372 Other current liabilities 133,762 158,746 Total current liabilities 1,890,057 1,825,174 Non-current liabilities Bonds and borrowings 993,122 1,034,562 Trade and other payables 2,302 74,806 Other financial liabilities 20,964 28,412 Retirement benefits liabilities 41,752 42,026 Provisions 26,208 26,258 Deferred tax liabilities 63,661 57,511 Other non-current liabilities 13,779 27,358 Total non-current liabilities 1,161,790 1,290,934 Total liabilities 3,051,847 3,116,109 Equity Share capital 64,936 64,936 Capital surplus 150,933 151,711 Treasury shares (3,596) (3,716) Other components of equity 50,394 7,758 Retained earnings 933,159 993,104 Total equity attributable to owners of the parent 1,195,826 1,213,795 Non-controlling interests 193,789 168,690 Total equity 1,389,616 1,382,486 Total liabilities and equity 4,441,464 4,498,595
SLIDE 7 − 7 −
(2) Consolidated Statements of Profit or Loss and Comprehensive Income Consolidated Statement of Profit or Loss
(Unit: Millions of yen)
Six Months Ended September 30, 2018 Six Months Ended September 30, 2019 Revenue Sales of goods 3,313,384 3,319,244 Sales of services and others 48,100 45,054 Total revenue 3,361,485 3,364,298 Cost of sales (3,046,417) (3,051,149) Gross profit 315,068 313,149 Selling, general and administrative expenses (208,738) (207,908) Other income (expenses) Gain (loss) on sale and disposals of non-current assets, net 286 499 Impairment losses on non-current assets (20)
846 2,905 Total other income (expenses) 1,113 3,404 Operating profit 107,442 108,646 Finance income (costs) Interest income 4,873 6,654 Interest expenses (13,142) (14,714) Dividend income 13,511 11,310 Other, net 878 13,497 Total finance income (costs) 6,121 16,748 Share of profit (loss) of investments accounted for using the equity method 7,853 (221) Profit before income taxes 121,417 125,173 Income tax expense (29,712) (34,657) Profit for the period 91,704 90,515 Profit (loss) for the period attributable to: Owners of the parent 78,615 79,138 Non-controlling interests 13,089 11,377 Earnings per share attributable to owners of the parent Basic earnings per share (yen) 223.41 224.91 Diluted earnings per share (yen)
SLIDE 8 − 8 −
Consolidated Statement of Comprehensive Income
(Unit: Millions of yen)
Six Months Ended September 30, 2018 Six Months Ended September 30, 2019 Profit for the period 91,704 90,515 Other comprehensive income Items that will not be reclassified to profit or loss: Remeasurements of defined benefit pension plans 161 285 Financial assets measured at fair value through other comprehensive income (24,842) (5,842) Share of other comprehensive income of investments accounted for using the equity method 632 (462) Items that may be reclassified to profit or loss: Cash flow hedges 1,679 (5,098) Exchange differences on translation of foreign operations (839) (39,693) Share of other comprehensive income of investments accounted for using the equity method (2,147) (531) Other comprehensive income for the period, net
(25,356) (51,342) Total comprehensive income for the period 66,348 39,173 Total comprehensive income for the period attributable to: Owners of the parent 51,952 35,409 Non-controlling interests 14,396 3,764
SLIDE 9 − 9 −
(3) Consolidated Statement of Changes in Equity Six Months Ended September 30, 2018 (April 1, 2018 to September 30, 2018)
(Unit: Millions of yen) Total equity attributable to owners of the parent Share capital Capital surplus Treasury shares Other components of equity Remeasurements of defined benefit pension plans Financial assets measured at FVTOCI* Cash flow hedges Exchange differences on translation of foreign
Total Balance at the beginning of the period 64,936 150,921 (3,578)
(12,961) (105,520) 129,943 Comprehensive income for the period Profit for the period Other comprehensive income Remeasurements of defined benefit pension plans 130 130 Financial assets measured at FVTOCI* (23,801) (23,801) Cash flow hedges 1,788 1,788 Exchange differences on translation of foreign
(4,780) (4,780) Total comprehensive income for the period
(23,801) 1,788 (4,780) (26,663) Transactions with owners Dividends Acquisition (disposal) of treasury shares (11) Acquisition (disposal) of non- controlling interests (101) Reclassification to retained earnings (130) 381 250 Other Total transactions with owners
(11) (130) 381 −
Balance at the end of the period 64,936 150,820 (3,589)
(11,172) (110,301) 103,530 Total equity attributable to owners of the parent Non-controlling interests Total equity Retained earnings Total Balance at the beginning of the period 832,495 1,174,718 187,468 1,362,187 Comprehensive income for the period Profit for the period 78,615 78,615 13,089 91,704 Other comprehensive income Remeasurements of defined benefit pension plans 130 131 Financial assets measured at FVTOCI* (23,801) (377) (24,179) Cash flow hedges 1,788 593 2,382 Exchange differences on translation of foreign
(4,780) 1,090 (3,690) Total comprehensive income for the period 78,615 51,952 14,396 66,348 Transactions with owners Dividends (17,253) (17,253) (11,740) (28,993) Acquisition (disposal) of treasury shares (11) (11) Acquisition (disposal) of non- controlling interests (101) (555) (657) Reclassification to retained earnings (250)
6 6 Total transactions with owners (17,503) (17,365) (12,289) (29,655) Balance at the end of the period 893,606 1,209,305 189,574 1,398,880 *Financial assets measured at FVTOCI represents “Financial assets measured at Fair Value through Other Comprehensive Income.”
SLIDE 10 − 10 −
Six Months Ended September 30, 2019 (April 1, 2019 to September 30, 2019)
(Unit: Millions of yen) Total equity attributable to owners of the parent Share capital Capital surplus Treasury shares Other components of equity Remeasurements of defined benefit pension plans Financial assets measured at FVTOCI* Cash flow hedges Exchange differences on translation of foreign
Total Balance at the beginning of the period 64,936 150,933 (3,596)
(10,226) (131,839) 50,394 Comprehensive income for the period Profit for the period Other comprehensive income Remeasurements of defined benefit pension plans 169 169 Financial assets measured at FVTOCI* (5,966) (5,966) Cash flow hedges 643 643 Exchange differences on translation of foreign
(38,574) (38,574) Total comprehensive income for the period
(5,966) 643 (38,574) (43,728) Transactions with owners Dividends Acquisition (disposal) of treasury shares (119) Acquisition (disposal) of non- controlling interests 777 Reclassification to retained earnings (169) 1,262 1,092 Other Total transactions with owners
(119) (169) 1,262
Balance at the end of the period 64,936 151,711 (3,716)
(9,583) (170,413) 7,758 Total equity attributable to owners of the parent Non-controlling interests Total equity Retained earnings Total Balance at the beginning of the period 933,159 1,195,826 193,789 1,389,616 Comprehensive income for the period Profit for the period 79,138 79,138 11,377 90,515 Other comprehensive income Remeasurements of defined benefit pension plans 169 (0) 168 Financial assets measured at FVTOCI* (5,966) (221) (6,187) Cash flow hedges 643 (2,546) (1,903) Exchange differences on translation of foreign
(38,574) (4,845) (43,419) Total comprehensive income for the period 79,138 35,409 3,764 39,173 Transactions with owners Dividends (17,605) (17,605) (9,211) (26,816) Acquisition (disposal) of treasury shares (118) (118) Acquisition (disposal) of non- controlling interests 777 (19,639) (18,862) Reclassification to retained earnings (1,092)
(494) (494) (11) (506) Total transactions with owners (19,192) (17,441) (28,862) (46,304) Balance at the end of the period 993,104 1,213,795 168,690 1,382,486 *Financial assets measured at FVTOCI represents “Financial assets measured at Fair Value through Other Comprehensive Income.”
SLIDE 11 − 11 −
(4) Consolidated Statement of Cash Flows (Unit: million yen) Six Months Ended September 30, 2018 Six Months Ended September 30, 2019 Cash flows from operating activities Profit before income taxes 121,417 125,173 Depreciation and amortization 38,247 49,126 Impairment losses on non-current assets 20
(6,121) (16,748) Share of (profit) loss of investments accounted for using the equity method (7,853) 221 (Gain) loss on sale and disposals of non-current assets, net (286) (499) (Increase) decrease in trade and other receivables (42,969) 107,517 (Increase) decrease in inventories (78,594) (62,287) Increase (decrease) in trade and other payables 74,590 (83,229) Other (14,554) 14,906 Subtotal 83,896 134,180 Interest received 4,812 6,322 Dividends received 25,800 22,610 Interest paid (12,453) (14,401) Income taxes paid (39,805) (36,507) Net cash provided by operating activities 62,251 112,204 Cash flows from investing activities (Increase) decrease in time deposits (5,184) (53,991) Purchase of property, plant and equipment (34,365) (54,037) Proceeds from sale of property, plant and equipment 4,845 3,469 Purchase of intangible assets (6,527) (6,008) Proceeds from sale of intangible assets 1,946 233 Proceeds from sale of investment property 4,286 760 Purchase of investments (17,221) (10,351) Proceeds from sale of investment 1,439 20,023 Proceeds from (payment for) acquisition of subsidiary (603) (7,482) Proceeds from (payment for) sale of subsidiaries 3,955 18 Payments for loans receivable (5,036) (2,691) Collection of loans receivable 7,027 3,901 Subsidy income
Other 1,999 699 Net cash used in investing activities (43,439) (95,605)
SLIDE 12
− 12 −
(Unit: million yen) Six Months Ended September 30, 2018 Six Months Ended September 30, 2019 Cash flows from financing activities Net increase (decrease) in short-term borrowings, net (7,333) (26,536) Proceeds from long-term borrowings 64,152 52,862 Repayment of long-term borrowings (82,802) (54,226) Proceeds from issuance of bonds 55,416 53,161 Purchase of treasury shares (12) (120) Dividends paid (17,253) (17,605) Dividends paid to non-controlling interests (11,740) (9,211) Proceeds from non-controlling interests 261 4,952 Payments for acquisition of subsidiaries’ interest from non- controlling interests (2,166) (861) Proceeds from sale of subsidiaries’ interest to non-controlling interests 137 263 Other (3,588) (9,518) Net cash provided by (used in) financing activities (4,929) (6,840) Net increase (decrease) in cash and cash equivalents 13,883 9,757 Cash and cash equivalents at the beginning of the period 423,426 465,861 Effect of exchange rate changes on cash and cash equivalents 915 (8,882) Cash and cash equivalents at the end of the period 438,225 466,736
SLIDE 13 − 13 −
(5) Notes on Consolidated Financial Statements (Notes on the Going-Concern Assumption) Not applicable (Changes in Accounting Policy) (Leases) Effective from the first quarter of the fiscal year ending March 31, 2020, the Group has adopted IFRS 16 Leases (published January 2016). IFRS 16 requires lessees to apply a single model of accounting to recognize all leases on the consolidated statement of financial position. At the commencement date of the lease, the lessee recognizes assets representing the right to use the underlying asset (the right-of-use assets) during the lease term and the obligations relating to the lease payments (lease liabilities). Then, the lessee recognizes a depreciation charge for the right-of-use asset and interest on the lease liability separately. With the adoption of IFRS 16, the following transitional measures and expedients have been applied. ・ The Group has elected a method to recognize the cumulative effect of initially applying IFRS 16 at the date of initial application. ・ For leases that were entered into on or before the date of initial application, IFRS 16 is applied to the leases that were previously identified as leases applying IAS 17 “Leases” and IFRIC 4 “Determining whether an Arrangement contains a Lease.” ・ For short-term leases and low-value leases, the right-of-use assets and the lease liabilities are not recognized. ・ On initial application, hindsight is used in determining the lease term. The weighted average of the lessee’s incremental borrowing rate applied to lease liabilities recognized in the statement of financial position at the date of initial application is 2.2%. In addition, the difference between a) the total of minimum lease payments that are related to non-cancellable
- perating lease contracts and disclosed applying IAS 17 as of March 31, 2019, and b) lease liabilities recognized
- n initial application of IFRS 16, is 13,375 million yen. The amount mainly reflects the effects of reviewing the
lease term in conjunction with the application of IFRS 16. Due to this, compared with what it would have been under the previous accounting standards, at the beginning
- f the period, the right-of-use asset included in property, plant and equipment increased 92,878 million yen, and
lease liabilities included in trade and other payables increased 93,004 million yen.
SLIDE 14 − 14 −
(Segment Information) Revenue, Profit/loss and Assets by Reportable Segment Six Months Ended September 30, 2018 (April 1, 2018 to September 30, 2018)
(Unit: million yen) Reportable segment Metals Global Parts & Logistics Automotive Machinery, Energy & Project Chemicals & Electronics Food & Consumer Services Revenue External 879,235 453,954 314,835 467,682 733,052 216,878 Inter-segment 991 11,841 6,834 1,431 5,989 242 Total 880,226 465,795 321,670 469,113 739,042 217,120 Gross profit 50,595 38,843 42,459 42,731 53,278 21,294 Profit for the period attributable to
17,145 13,050 10,619 12,030 11,105 2,698 Segment assets 911,238 404,308 295,190 767,067 738,861 283,157 Reportable segment Other *1 Adjustments *2 Consolidated Africa Total Revenue External 294,369 3,360,008 1,477
Inter-segment 6,219 33,548 430 (33,978)
300,588 3,393,557 1,907 (33,978) 3,361,485 Gross profit 67,925 317,127 1,416 (3,476) 315,068 Profit for the period attributable to
6,428 73,078 5,619 (82) 78,615 Segment assets 551,909 3,951,734 820,467 (297,315) 4,474,886
Notes: 1. “Other” comprises businesses that are not included in reportable segments including functional services which provide
- peration support to the whole Group. In addition, this column includes profit/loss that is not classified into a specific
reportable segment.
- 2. Figures in “Adjustments” represent the amounts of inter-segment transactions.
- 3. Prices in inter-segment transactions are decided based on negotiation on an individual basis.
SLIDE 15 − 15 −
Six Months Ended September 30, 2019 (April 1, 2019 to September 30, 2019)
(Unit: million yen) Reportable segment Metals Global Parts & Logistics Automotive Machinery, Energy & Project Chemicals & Electronics Food & Consumer Services Revenue External 862,293 448,925 313,644 386,333 741,280 210,653 Inter-segment 1,095 12,970 843 3,010 2,331 278 Total 863,389 461,896 314,487 389,344 743,612 210,931 Gross profit 47,751 38,372 42,240 42,076 50,527 23,190 Profit (loss) for the period attributable to owners of the parent 7,514 14,133 8,356 27,726 9,480 1,709 Segment assets 899,187 398,836 285,454 759,082 708,659 284,925 Reportable segment Other *1 Adjustments *2 Consolidated Africa Total Revenue External 398,365 3,361,496 2,802
Inter-segment 34 20,565 881 (21,447)
398,400 3,382,061 3,683 (21,447) 3,364,298 Gross profit 70,836 314,995 (249) (1,596) 313,149 Profit (loss) for the period attributable to owners of the parent 6,812 75,732 3,434 (28) 79,138 Segment assets 558,325 3,894,471 891,152 (287,027) 4,498,595
Notes: 1. “Other” comprises businesses that are not included in reportable segments including functional services which provide
- peration support to the whole Group. In addition, this column includes profit/loss that is not classified into a specific
reportable segment.
- 2. Figures in “Adjustments” represent the amounts of inter-segment transactions.
- 3. Prices in inter-segment transactions are decided based on negotiation on an individual basis.
SLIDE 16 (For reference)
Outline of Consolidated Results
Toyota Tsusho Corporation (Unit: Billion yen)
×
102.0 23.0
Exchange rate
Six Months ended September 30, 2018 (As of March 31, 2019) Six Months ended September 30, 2019
24.0 92.0
26.5% 100 yen 60 yen 120 yen
(forecast)
28.2%
(forecast)
77.0 24.0 36.0
(111) 121
0.4
6.0% Profit
Profit attributable to
25.4% 110 109
93.0
Full year 94 yen
251.0
Interest rate
237.0
11.0
Profit before income taxes 108 (125) 118 2.34% 2.35% 368 390 130 Total
315.0 313.1
(1.9)
(0.6%)
78.6 79.1
0.5
0.7% Africa
67.9 70.8
2.9
4.3% Increased largely driven by growth in automobile sales volume.
6.4 6.8
Payout ratio (consolidated) Decreased largely due to worsening of share of profit/loss of investments accounted for using the equity method in the overseas automotive sales business.
Metals
50.5 176.0
C
p
a t e
663.0
US dollar LIBOR 3M average Corn futures (cents/bushel) Dubai oil (US dollars/bbl.)
48.0
Yen / US dollar
6M average End of period
141.0
Food & Consumer Services 73 64
Yen TIBOR 3M average
0.07% 0.07% Machinery, Energy & Project
42.7 42.0
Increased largely driven by higher trading volume of automotive parts.
End of period
(0.7) 110.0 5.0 Changes in Major Indexes 27.0
10.6 8.3
Global Parts & Logistics Automotive
42.4 42.2
(0.2)
Yen / Euro
6M average
21.2 23.1
1.9
8.9% Decreased largely due to impairment loss in the food business. Chemicals & Electronics
53.2 50.5
(2.7)
2.6 1.7
(0.9)
(36.7%) Decreased largely due to lower profit margin of the electronics business.
11.1 9.4
(1.7)
(14.6%)
D i v i s i
s
17.1 7.5
(9.6)
(56.2%)
13.0
(21.3%) (1.5%) Increased largely due to the gain on sale of shares in affiliate in the electric power business.
12.0 27.7 14.1
1.1
8.3%
(0.5) 15.7
130.5% (5.2%)
(2.3)
Decreased largely due to impairment loss in the metal resources business. (0.5%)
*The top row for each division indicates gross profit; the bottom row indicates profit for the period attributable to owners of parent.
Profit attributable to
78.6 38.8 38.3
Total comprehensive income (attributable to owners of the parent)
51.9 35.4
(16.5)
(31.8%) (1.2%)
79.1
0.5
0.7%
Year ending March 31, 2020
Divisions
Six Months ended Sep. 30, 2018 Six Months ended Sep. 30, 2019
Year-on-year change
Main factors behind year-on-year changes in profit attributable to owners of parent
Dividend per share Interim 45 yen 50 yen
Year ended March 31, 2018 Year ended March 31, 2019
47.7
(2.8)
(5.6%)
Amount % Year ended March 31, 2019
*The top row for each division indicates gross profit; the bottom row indicates profit attributable to owners of the parent.
99.8 35.3
Consolidated Financial Results Forecasts
Metals Global Parts & Logistics
Cash flows from financing activities
(4.9) (6.8) (1.9) (43.4) (95.6) (52.2) 50.0
Income tax expense
(29.7) (34.6)
(4.9)
-
investing activities Profit before income taxes
121.4 125.1
3.7
3.1%
- 1. Cash flows from
- perating activities
Profit for the period
91.7 90.5
(1.2)
(1.3%)
1-2: Free cash flow
18.8 16.6 (2.2) 62.2 112.2
Share of profit of investments accounted for using the equity method
7.8 (0.2)
(8.0)
-
Other finance income (costs)
0.8 13.4
12.6
-
Dividend income
13.5 11.3
(2.2)
-
Operating profit
107.4 108.6
1.2
1.1% Interest income (expenses)
(8.2)
SG&A expenses
(208.7) (207.9)
0.8
-
(Non-current assets)
1,638.2 1,717.6 79.4 Other income (expenses)
1.1 3.4
2.3
-
Total equity
1,389.6 1,382.4 (7.2)
Consolidated Operating Results
Six Months ended Sep. 30, 2018 Six Months ended Sep. 30, 2019
Year-on-year change
Main factors behind year-on-year changes Consolidated Financial Position Gross profit
315.0 313.1
(1.9)
(0.6%)
(Current assets)
Revenue
3,361.4 3,364.2
2.8
0.1%
Total assets
Amount %
October 31, 2019 【Cash flows from operating activities】 Profit for the six months ended September 30, 2019 【Cash flows from investing activities】 Purchase of property, plant and equipment
for the Six Months ended September 30, 2019 (IFRS)
1Q 158.6 55.6 55.6
As of March 31, 2019 As of September 30, 2019
Change over the end of the previous fiscal year
Main factors behind year-on-year changes
4.5% 4,441.4 4,498.5 57.1 1.3%
2,803.2 2,780.9 (22.3) (0.8%) 4.8%
(0.5%) 0.1 44.1
Main factors behind year-on-year changes
Amount %
Net interest-bearing debt
988.4 1,032.5
Debt-equity ratio (times)
0.8 0.9
Six Months ended Sep. 30, 2018 Six Months ended Sep. 30, 2019 Year-on- year change Consolidated Cash Flow Position
154.4 52.9 23.5 2Q Quarterly changes Gross profit Operating profit Profit attributable to
(8.0)
0.2
- Automotive Machinery, Energy & Project Chemicals & Electronics Food & Consumer Services Africa Gross profit Operating profit
75.3 23.7 88.7 22.7 89.8 18.7 107.5 18.4 43.9 1.7 137.1 10.1
638.4 215.1 229.1 154.7 132.6
102.0 26.0 77.0 24.0 92.0 24.0 93.0 37.0 110.0 23.0 48.0 5.0 141.0 11.0
663.0 237.0 13.1% 251.0 176.0 150.0
(Revised) Year ending March 31, 2020 % Amount Year-on-year change
2.2 (9.3) 1.7 0.3 3.3 1.3 3.2 18.3 2.5 4.6 4.1 3.3 3.9 0.9
24.6 150.0
(Reference) Forecast for Year Ending March 31, 2020 issued
2020
21.9 21.9 21.3 17.4
2.1% (26.4%) 2.2% 0.8% 3.7% 5.5% 3.5% 97.0% 2.3% 24.7% 9.3% 183.7% 2.8% 8.7%
3.8% 10.1% 9.5% 13.7%
【Gross profit】 -1.9 billion yen Decreased largely due to lower profit margin in the Chemicals & Electronics Division, which offset growth in automobile sales volume in the Africa Division. 【Operating profit】 +1.2 billion yen Despite the decrease in gross profit, operating profit increased largely due to improvement in foreign exchange gain/loss. 【Profit attributable to owners of the parent】 +0.5 billion yen Increased largely driven by gain on sale of shares in affiliate in the Machinery, Energy & Project Division, which offset worsening of share of profit/loss of investments accounted for using the equity method accompanying impairment losses in the Metals Division and the Food & Consumer Services Division. 【Current assets】 -22.3 billion yen ・Trade and other receivables:
・Inventories: +46.1 billion yen ・Other financial assets: +61.7 billion yen 【Non-current assets】 +79.4 billion yen ・Property, plant and equipment: +109.1 billion yen ・Other investments:
【Total equity】 -7.2 billion yen ・Retained earnings: +60.0 billion yen ・Exchange differences on translation of foreign
- perations:
- 38.6 billion yen
・Non-controlling interests: -25.1 billion yen