
SLIDE 1
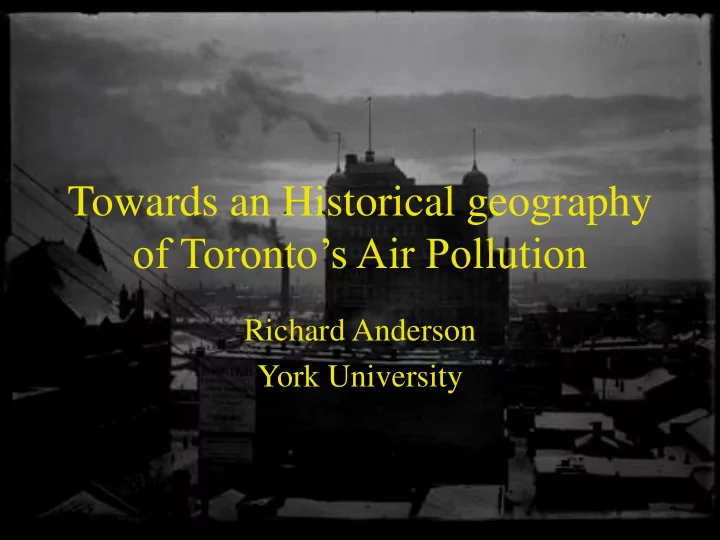
Towards an Historical geography
- f Toronto’s Air Pollution
Towards an Historical geography of Torontos Air Pollution Richard - - PowerPoint PPT Presentation
Towards an Historical geography of Torontos Air Pollution Richard Anderson York University 1900s Bay-Adelaide 1915 1928 1922 1923 1948 1959 Urban Air Pollution A key attribute of urban environmental health Obviously a
Toronto: Pneumonia and Broncho-Pneumonia Mortality (deaths/000 people) 0.00 5.00 10.00 15.00 20.00 25.00 30.00 35.00 40.00 Jan 1876 Jan 1879 Jan 1882 Jan 1885 Jan 1888 Jan 1891 Jan 1894 Jan 1897 Jan-00 Jan-03 Jan-06 Jan-09 Jan-12 Jan-15 Jan-18 Jan-21 Jan-24 Jan-27 Jan-30 Jan-33 Jan-36
Toronto: Respiratory Mortality 1903
5 10 15 20 25
Jan-03 Feb-03 Mar-03 Apr-03 May-03 Jun-03 Jul-03 Aug-03 Sep-03 Oct-03 Nov-03 Dec-03
CDR % due to Pneumonia & Bronchitis
Toronto 1903: Bronchitis and Pneumonia as % of deaths
5 10 15 20 25 Jan- 03 Feb- 03 Mar- 03 Apr- 03 May- 03 Jun- 03 Jul-03 Aug- 03 Sep- 03 Oct- 03 Nov- 03 Dec- 03 All Infants
Toronto Combustion 000 tonnes CE
1000 2000 3000 4000 5000 6000 7000 1820 1840 1860 1880 1900 1920 1940 1960 Coal Wood Incineration Petroleum
Toronto Air Pollution Mean visibility (metres) vs estimated particulate emissions from coal burning
200 400 600 800 1000 1200 1400 1900 1910 1920 1930 1940 1950 1960 1970 Mean vis tpm/000