
SLIDE 1
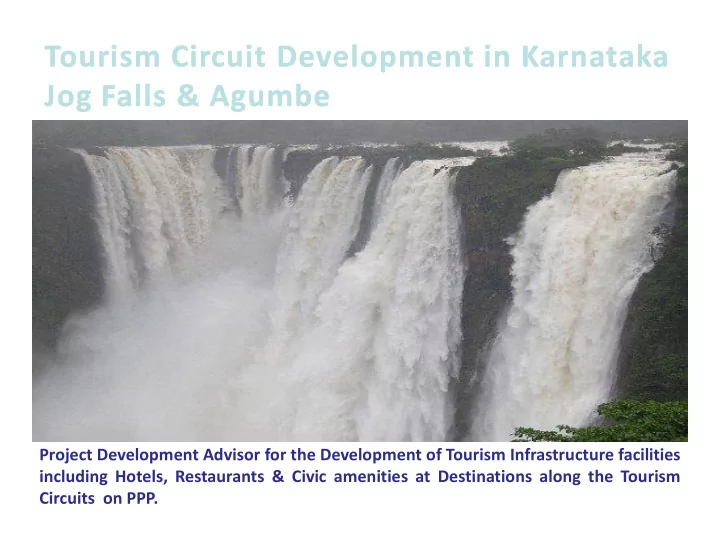
Project Development Advisor for the Development of Tourism Infrastructure facilities including Hotels, Restaurants & Civic amenities at Destinations along the Tourism Circuits on PPP.
Tourism Circuit Development in Karnataka Tourism Circuit Development - - PowerPoint PPT Presentation
Tourism Circuit Development in Karnataka Tourism Circuit Development in Karnataka Jog Falls & Jog Falls & Agumbe Agumbe Project Development Advisor for the Development of Tourism Infrastructure facilities including Hotels, Restaurants
Project Development Advisor for the Development of Tourism Infrastructure facilities including Hotels, Restaurants & Civic amenities at Destinations along the Tourism Circuits on PPP.
Advertisement for REQUEST FOR PROPOSAL
Newspaper Advertisement : Economic Times & Vijaya Karnataka Dated 31/05/2010
– Design-Finance-Build-Operate-Transfer (DFBOT) – Concession Period – 30 Years
– Estimated Project Costs: – Jog Falls: Rs. 16 Crores – Agumbe : Rs. 0.50 Crores – IRR : 20% +
Tender Process
Project Details Available at
Contact Details
– Vishal Salgaonkar, – Senior Manager, – IL&FS Infrastructure Development Corporation Ltd, – Al-Latheef, 1st Floor, # 2, Union Street, – Off Infantry Road, Bangalore 560 001 – Ph: +91-80-40343326 – Fax: +91-80-40343310
Sustainable Action
Bio-methanation, Waste to Energy, Grid Buildings
plants
measures
transport
BRT
– Funding for Sustainable Infrastructure
106
Sustainable Infrastructure Action Plan for Karnataka Phasing SIAP Theme SIAP Key Steps Activity Description for Karnataka Fund Requirement (USD Mn) Stage I: Six Months
Access Gap through Core Sector Strategies Sector Strategy
Sectors- Transportation, Energy, Water, ICT etc
1.0
Effectiveness through cross sectoral themes
Program for Harnessing Karnataka Specific Cross Sectoral Synergy- Climate Change, PPP and R-U Integration 2.0
1.0
– Know how, and the technical assistance required; and – Funding for Sustainable Infrastructure
107
Stage II: Six Months
Program 1.Environment
4.Viability
against Environment, Social and Governance factors and Climate Change 0.5
Holders 1.5
Infrastructure users 2.5
undertake survey of users of these green infrastructure 0.5
5.0
Robust MIS 5.0
See below
Contd……
108
Stage II: Six Months (contd)
finance
Public Finance
through Partnerships
financing projects based on their emphasis on key factors as Climate Change, Environmental, Social and Governance etc. 1.0
based on complex parameters 5.0
1.0 Stage III: After 12 Months
Fund and Project Funding
Project Grant/ Finance (Refer Table in Para 5.3 ‘Leveraging Finance’) 8586.34 Total (USD Mn)
8612.34
continued
Creation of Fund and Project Funding
– Addressing the Access Gap through Core Sector Strategies and Maximizing Effectiveness through cross sectoral themes – Master Plan for Infrastructure Sectors- Transportation, Energy, Water, ICT etc – Institutional Strengthening Program for Harnessing Karnataka Specific Cross Sectoral Synergy- Climate Change, PPP and R-U Integration – Capacity Building
– Funding for grading of projects against Environment, Social and Governance factors and Climate Change – Capacity Building within Gov Stake Holders – Awareness Building among Infrastructure users – Create Infrastructure Index and undertake survey of users of these green infrastructure – Setting up of Regulatory Structures – Project Level Monitoring through a Robust MIS – Supporting Viability funding
109
– Development of program for financing projects based on their emphasis on key factors as Climate Change, Environmental, Social and Governance etc. – Funding for grading of projects based on complex parameters – Capacity Building – Creation of 'Sustainable Fund' for Project Grant/ Finance to the tune of 20% on projects meeting Sustainability Criteria.
110
envisaged in Vision 2020 document (Oct 2008) of GoK
Infrastructure distinguishes the ‘haves’ from the ‘have-nots’ and paves way for human development, thus reducing the disparity among social classes
actively seek the support of Multilateral Funding agencies in financial assistance and capacity building services
implementation
111
Infrastructure Development Department
12/3/2010 112
Presently 4.5% of GSDP Target 9 % of GSDP India Competitive Index- 49 Huge deficit in Tax- GDP ratio 22 %(35 %) Investment requirements:
Rs 92462 cr
( 11th plan)
Present Investment :
Rs 11000 cr
Required Annual Investment :
Rs20- 21,000 cr
12/3/2010 113
!" !" !"
#$ #$ #$ #$ " " " " %&" %&" %&" %&"
'(
'( '( '(
) ) ) *( *( *( *( +, +, +, +,
(/$ (/$ (/$ " " " " %" %" %" %"
01)
01) 01) 01)
"#
$ %&2 '!!&! ( $)*+$)* "%' '"" '&,,$-*./ 0'%'$.-/1 '2 $.$-'& * "!2 !&%%!&! ( $)*+$)* %!"!3 '%&"4.-#"562"%'27*839*3 *9$9 '," '%&"3!&%%4:9#"527/991*9$9 %'-1.9! $$: '2 '& /-.9 *99;3$9 / &2 6 $)/+*)/ %!2"%',!' 27/$9/3*9$9 ' % ! 27/$9-$9%'$.:99! *9$/; '2 '&:-/;<&',", "% !% *99;3$9 : = !2 !2 " !"'&2 ! $)/+*)/ "%', %! *98; <&',",, 0 . " !"2 7 '&2 ! $)/+*)/ %!"2'! ' /2# 3 /*:1-:8$.2 %'27,= <&' *1-.* ',"% /7 1 & 2'2 & 6 $)*+$)* ,',"7 *99839;>"" ' !3 2!&' %(''$.99 *99839;! ,*.--. ', ',2'!&% 2!&' ',2'! '6#27 '2!&''&' 2' ' (2= <&'," *:*-. ',"% .7
+ *99;3$90,$*9;.'&,","%'% ' $99,= !3 7>& 2'3&%,"*., =4*:.;. *99;3$95,('?
116
!" # # $%%!" % & %!' & (% !' )*+, & # -%!' . + / + + # # +/ 0 !1 %%%!" + # + .023.04435 +
117
5 + ++ / !6 6+ # # %7/ 7%%% !" '! 8 96 3.0 $%% !" 0 # 6+ : # 805 ;4 9<5 %% !" 0 # 6+ : # 805 ;4 9<5/ $%% !" + # 6+ # 805 = 0/ 9> 9. - # 805/ 8 3+ 6+ ? @%% !"
118
7%% !" < # 805/ 7%% !" # 9 # 805/ 7%%% !" ++
+ *# +A + + / #
# +/ %%!" # + 9> > & # 085
# # 085/
+ + 0> 5 3 / < + " + # 0 > =.3 + /
Infrastructure Development Department
22 Oct 2010 120
V Madhu Principal Secretary, IDD Govt of Karnataka Room No 28, Vikasa Soudha, Dr Ambedkar Veedhi, Bangalore- 560001, Karnataka Phone 080-22035085 Email: prs-infra@Karnataka.gov.in v.madhu1952@yahoo.com Director/ PPP (E), ADB PPP Cell, IDD Govt of Karnataka Room No 8, Vikasa Soudha, Dr Ambedkar Veedhi, Bangalore- 560001, Karnataka Phone 080-22034070 Email: director.idd@gmail.com
12/3/2010 Infrastructure Policy 2007 122 Owners Mode wise break-up Total Thermal Nuclea r Hydro (Renewable) Res** Coal Gas Diesel Total Thermal MW ( % ) MW ( % ) MW ( % ) MW ( % ) MW ( % ) MW ( % ) State 1970 21.08
1.37 2097.92 22.45 0 3518.2 37.64 452.4 4.84 6068.52 Private 260 2.78 220 2.35 106.5 1.14 586.5 6.27
15.28 2014.6 Central 1072.67 11.48
11.48 190.9
Total 3302.67 35.34 220 2.35 234.42 2.51 3757.09 40.2 190.9 3518.2 37.64 1880.5 20.12 9346.69
12/3/2010 Infrastructure Policy 2007 123
RE Source Target MW Year wise proposed capacity addition 2009-10 2010-11 2011-12 2012-13 2013-14 Wind Power 2769 530 580 530 530 599 Mini and Small Hydro 500 100 100 100 100 100
281 56 56 56 56 57 Biomass/Bio-gas 500 100 100 100 100 100 Waste to Energy 50 10 10 10 10 10 Solar PV and Thermal 100 20 20 20 20 20 Total 4200 816 866 816 816 886
12/3/2010 Infrastructure Policy 2007 124
Total Inhabited village (2001 census) Villages electrified Un-electrified villages Numbers (%) 27481 27458 99.9 23
12/3/2010 Infrastructure Policy 2007 125
Sl.No. IP installations BJ/KJ installations Total Metered Metered (%) Total Metered Metered (%) 1BESCOM 552221 46392 8.40 610409 346460 56.76 2GESCOM 241846 31968 13.22 439162 257577 58.65 3HESCOM 492731 147283 29.89 595659 439079 73.71 4MESCOM 183601 168392 91.72 131448 100354 76.35 5CESC 185977 38896 20.91 300278 294912 98.21 6HUKKERI 17683 5676 32.10
1674059 438607 26.20 2076956 1438382 69.25
12/3/2010 Infrastructure Policy 2007 126
Emission (Million t-CO2) 2006-07 2008-09 2009-10* 2010-11* State Coal 10.92 14.63 16.49 20.21 State Diesel 0.54 0.54 0.54 0.54 Private Coal 1.18 1.18 3.92 8.54 Private Gas 0.78 0.78 0.78 0.78 Private Diesel 0.50 0.50 0.50 0.5 Total 13.92 17.63 22.23 30.57 * Calculated on the basis of installed capacity expected in the state in coming years and current grid emission of various technologies
12/3/2010 Infrastructure Policy 2007 127
Industris with no. of factories registered (nos) 50-300 300-500 500-1000 1000+
(21) Manufacture of Paper & Paper products (245) (BM) & Water recycling (17) Manufacture of Cotton Textiles (334) (COGEN) (18) Manufacture of wool, Silk, Synthetic Fibre, Textiles (884) (Process heat / steam) (15) Manufacture of Food products & beverages (1978) (BM) (32) Manufacture Radio, Television & Communication equipment & apparatus (286) (25) Manufacture Rubber, Plastic, Petroleum & Coal products (444) (Solid waste recycling) (24) Manufacture Chemicals & Chemical products (except products
(Process heat / steam) (20) Manufacture of Wood & wood products, Furnitures & Fixtures (170) (Solid Wate recycling (31) Manufacturinng of Electrical, machinery & apparatus NEC (392) (29) Manufacture of machinery, Machine tools & parts except electrical machinery (573) (28) Manufacture of Metal products & parts except machinery & transport equipments (1209) (SWR) (33) Manufacture of Medical precision & optical instruments, watches and clocks (134) (50) Sale maintenance & Repairs of motor vehicles, motor cycles, retail sale of automotive (416) (26) Manufacture of Non- mettalic mineral products (572)
12/3/2010 Infrastructure Policy 2007 128
Industries with no. of factories registered (nos) 50-300 300-500 500-1000 1000+
(34) Manufacture of Motor vehicles, Trailers & Semi-trailers (121) (14) Cotton ginning, Cleaning & baling (387) (EC) (36) Manufacture of Furniture, Manufacturing NEC (112) (27) Basic metal & Alloy industries (331) (Heat recovery & conservation) (16) Manufacture of Beverages, Tobbaco & Tobbaco products (59) Solar air drying (19) Manufacture of Textile products (including wiring apparel
(54)EC,SWR,Process heat / steam EC- Energy Conservation; BM - Bio Methanation ; SWR - Solid Waste Recycling Note : Prefix no in bracket shows the NIC number for Industry groups and numbers in braket after the industry name indicates number of factories under that particular industry (NIC group, 1998); in 2004-05. in the cell, the text in bold indicates the name of the clean energy technological solution that can be implemented into the category
12/3/2010 Infrastructure Policy 2007 129
Sl.No. Year Vehicles Sl.No. Year Vehicles 1 1991 14.33 10 2000 33.52 2 1992 15.83 11 2001 36.92 3 1993 17.19 12 2002 39.96 4 1994 18.76 13 2003 44.83 5 1995 20.15 14 2004 48.75 6 1996 22.5 15 2005 54.35 7 1997 25.35 16 2006 62.2 8 1998 28.05 17 2007 69.4 9 1999 30.67 18 2008 75.19
Consumption (thousand tones) of major petroleum products by state (Public sector unit scale only) : Karnataka
12/3/2010 Infrastructure Policy 2007 130
Year Nap thane LPG Petrol SKO ATF HSD LDO FO LSHS / HHS Lubes / Greases Bitumen Others Total 2001-02 371 415 482 525 91 2167 34 525 154 33 34 4831 2003-04 303 547 502 483 118 2372 47 493 87 35 195 22 5204 2004-05 262 629 506 472 148 2433 51 549 66 37 212 23 5388 2005-06 213 653 514 471 199 2388 41 517 25 36 282 30 5369 ATF : Aviation Turbine Fuel SKO : Superior Kerosine Oil HSD : High Speed Diesel LDO : Light Deisel Oil FO : Furnace Oil LSHS / HHS : Low Sulpher Heavy Stock / Hot Heavy Stock
Season-Wise Agricultural Crops recommended for different Agro-climatic Zones of Karnataka (1/2)
12/3/2010 Infrastructure Policy 2007 131 Zone No. Name Rainfall range (mm) District (No. of Taluks) Kharif Rabi 1 North Eastern Transaction Zone 830-919 Bidar (5) & Gulbarga (2) Jowar, Blackgram, Greengram, Tur, Bajra, Sunflower, Sesamum, Niger, Paddy, M.Millets, Sugarcane Bengalgram, Jowar, Wheat, Sunflower, Safflower, Linseed 2 North Eastern Dry Zone 633-807 Gulbarga (8) & Raichur(3) Tur, Sunflower, Groundnut, Bajra, Greengram, Blackgram, sesemum, Jowar,Cotton,Sugarcane, Paddy Bengalgram, Jowar, Wheat, Sunflower, Safflower, Linseed 3 Northern Dry Zone 465-786 Koppal (4), Gadag (4), Dharwad (1), Belgaum (5), Bijapur (5), Bagalkot (6), Bellary (7), Davangere (1), Raichur (2) Sunflower, Groundnut, Bajra, Greengram, Horsegram, sesamum, Jowar,Paddy, Cowpea, M.Millets, Cotton, Tur, Castor, Niger, Maize Bengalgram, Jowar, Wheat, Sunflower, Safflower, Linseed, Cotton 4 Central Dry Zone 456-717 Chitradurga (6), Davangere (3), Tumkur (6), Chikmangalore (1), Hassan (1) Groundnut, Raagi, Maize, Jowar, Sunflower, Tur, Avare, Paddy, Sesamum, Horsegram, Cotton Jowar, Sunflower, Horsegram
Season-Wise Agricultural Crops recommended for different Agro-climatic Zones of Karnataka (2/2)
12/3/2010 Infrastructure Policy 2007 132 Zone No. Name Rainfall range (mm) District (No. of Taluks) Kharif Rabi 5 Eastern Dry Zone 679-889 Bangalore Rural (8), Bangalore Urban (3), Kolar (11), Tumkur (2) Raagi, Paddy, Avare, Maize, Groundnut, Castro, Niger, Horsegram Horsegram 6 Southern Dry Zone 671-889 Mysore (4), Chamarajanagara (4), Mandya (7), Tumkur (2), Hassan (2) Paddy, Raagi, Jowar, Maize, Tur, Horsegram, Cowpea, Avare, Groundnut, Sesamum, Sunflower, Castro, Niger, Cotton, Tobbaco, Sugarcane Raagi, Maize, Horsegram, Cowpea 7 Southern Transcation Zone 612-1054 Hassan (4), Chikmangalore (1), Shimoga (3), Mysore (3), Davangere (2) Paddy, Raagi, Jowar, Maize, Tur, Horsegram, Cowpea, Avare,Groundnut, Sesamum, Sunflower, Castro, Niger, Cotton, Tobbaco, Sugarcane Raagi, Horsegram, Paddy, Sunflower, Bengalgram 8 Northern Transaction Zone 618-1303 Belgaum (4), Dharwad (3), Haveri (6), Gadag (1) Groundnut, Jowar, Maize, Paddy, Cotton, Sugarcane, Tobbaco, Bajra, Tur, Sunflower, Soyabean, Greengram, Horsegram, Avare, M.Millets, Cowpea Jowar, Wheat, Maize, Sunflower, Bengalgram, Horsegram, Linseed, Safflower
12/3/2010 Infrastructure Policy 2007 133
Year N P K Total 2000-01 7.32 3.84 2.33 13.49 2001-02 6.71 3.6 2.18 12.49 2002-03 6.01 3.04 1.95 11 2003-04 4.93 2.4 1.86 9.19 2004-05 6.61 3.64 2.73 12.98 2005-06 7.54 4.35 3.35 15.24 2006-07 7.56 4.39 2.91 14.86 2007-08 7.9 3.87 3.3 15.07
12/3/2010 Infrastructure Policy 2007 134
District Annual reperish able ground water resourc es Natural discharge during non monsoon season Net ground water availabilit y Irrigatio n draft (A) Domestic & Industrial use draft (B) Total Draft (A+B) Ground water availabili ty for future Stage of ground water develop ment (%) Hassan 54421 2238 52183 31152 5709 36861 15906 71 Haveri 42515 1845 40670 26247 2870 29117 13182 72 Davangere 61472 1861 59610 42656 3176 45832 200075 77
12/3/2010 Infrastructure Policy 2007 135
Year Cumulative
12/3/2010 Infrastructure Policy 2007 136
Name of the Location / Station Type of Area Air Quality RSPM (g/m3 ) SO2 (g/m3 ) NOx (g/m3 ) SPM (g/m3 ) Over the terrace of Regional office building plot no. 97, AIA, Tumkur Industrial Area 81.16 45 54 229.1 KSPCB office building Industrial Area 33.26 3.59 15.76 72.09 Baikampadi Industrial Area Mangalore during Industrial Area 83 9.98 9.11 309 Vivekanandaiah Petrol Bank, Chitradurga Commercial Area 248.45 12.42 6.3 84.05 Regional office building, Chitradurga Residential Area
5.97 192.16 Regional office KSPCB, Davangere Residential Area 46.75 8.2 6.12 44.52 PWD office building, Davangere Other Area 286 16.22 11.4 296 Port director's office, Karwar Rural & Other Area 176.63 3.17 5.87
Urban & Mixed Area 91 5.7 24.6 234
12/3/2010 Infrastructure Policy 2007 137
Municipal Solid waste As regards municipal waste, on average 40% to 50% of the total is municipal and is generated in the six municipal corporations of the Karnataka and more than 76% of the municipal waste is generated by the Residential & market areas Municipal Solid waste generated per day in 6 cities corporation of Karnataka for 2002 City Corporation Population Waste Generated (Ton / day ) Waste collected (Tons / day) Per capita waste generated (gms / day) Bangalore 5,882,162 2500 1400 425 Mangalore 551,701 250 200 453 Hubli / Dharwad 801,442 250 200 311 Mysore 794,677 230 183 289 Belgaum 516,155 120 100 232 Gulbarga 452,944 120 100 262 Total 8,999,081 3,470 2,183 1,972
Comparison between BAU and Projected Scenario model of Road Transportation in Karnataka in terms of Carbon emission in both
cases
12/3/2010 Infrastructure Policy 2007 138
2010-11 2020-21 2030-31 BP Km CO2 Emission (1000 tons of carbon equivalent) BP Km CO2 Emission (1000 tons of carbon equivalent) BP Km CO2 Emission (1000 tons of carbon equivalent) BAU Scenario Projected BAU Scenario Projected BAU Scenario Projected Private & Par transit 127.15 1277.87 751.69200.77 2017.69 1186.88358.64 3604.35 1629.45 Bus 172.03 720.8 940.17271.62 1138.1 1484.48 289.9 1214.67 2038.03 Total 299.18 1998.67 1691.86472.39 3155.79 2671.36648.54 4819.02 3667.48
– Access and affordability
– Eg: Logistics infrastructure across the state
– Capacity in GoK agencies in limited – Need for integrated policies – Institutional Mechanism for coordination
– Central, state, city, private sector
– Similar to ESCOs in Energy Market : Who can invest in sustainable components and can charge tariffs
12/3/2010 139
Development Vision (1/2)
Units Level Present 2020 Economic Sector 1 Agriculture Irrigated Area % on potential 49>90% Lakhs Hectares 30 61 Lakhs Hectares 45 Watershed Area Lakhs Hectares 44.75 Agricultural Labour % of total 61 35 Agricultural Growth % 0.8 4 2Public Transport On total trips % 45 73 (a) Public Transport with renewable energy % 100 3Forest Area covered % 6.7 33 4Industry Growth % 7.9 9 (a) Industrial Employment % 15 22 5Road Average Km / sq.Km 1.07 1.50 NH + SH Km 21486 40000 ≥ 2 lanes Km 6466 66456 All weather Roads % 60 100 6Electricity Infrastructure Capacity MW 18500 T&D Loss % 28 < 15 Agriculture IP Set metering % 29 > 90
Development Vision (2/2)
Units Level Present 2020 7Railways Rail Density Km /1000 sq.Km 17 28 8Output per workers (Agri : Service) Ratio 8:8 4:9 9Cold Storage Capacity 1000 MT 250 4800
Literacy Rate Literacy Rate % 67 100 Access to Skill Training % 100 Health IMR (Infant Mortality Ratio) No. 48 10 MMR (Maternal Mortality Ratio) No. 228 25 Population Spread Urban Crores 2.08 2.8
Rural Poverty % 20.8< 5 Urban Poverty % 32.8 Access to water LPCD 27 100 Slum population % 7.8 D. SPM > 160 40
Ongoing Cost Sharing Railway Projects in Karnataka
Sl.No. Project Name Length in KM Project Cost (Rs. In crores) Status
1 Solapur - Gadag (GC) 284 335.00 Completed 2 Shimoga - Talaguppa (GC) 97 225.00 Shimoga - Anandapuram GC Completed in 2009-10 Anandapuram - Talaguppa targeted for commissioning by March 2011 3 Ramanagaram - Mysore (DL) 93 487.00(ant) Ramanagaram to Shettihalli and Mysore to Naganahalli targeted by March 2011 and balance by 2013 4 Kottur - Harihara (NL) 67 330.00 All works completed and section is ready for goods services. Passengers services will be introduced in 2011 5 Munirabad (Ginigera) - Mehaboobnagar (NL) 170 1050.00 Works are in progress from (Ginigera) Munirabad end 6 Bidar - Gulbarga (NL) 107 369.00 Work in Progress in Bidar District. In Gulbarga District land acquisition progress under finalisation. Total 818 2796.00 GC Guage Conversion DL Doubling NL New Line
The States Potential in Renewable Energy Sector Potential in MW Allotted in MW, 2010 Commissioned in MW, 2010 Wind 13236 9234 1511 Small Hydro 3000 2351 451 Cogeneration 1500 1078 648 Biomass 950 476 87 Solar 20000 129 6 Total 38686 13268 2703
Year wise generation (MU) and capacity utilization factor (%) in Karnataka: 1996/97 to 2007/08
12/3/2010 Infrastructure Policy 2007 144
0% 5% 10% 15% 20% 25% 30% 35% 40% 0.00 200.00 400.00 600.00 800.00 1000.00 1200.00 1400.00 1600.00 Generation, MU Capacity Factors
– Vision 2020 Sectoral Targets
& Inclusiveness
145
12/3/2010 Infrastructure Policy 2007 146
147
12/3/2010 Infrastructure Policy 2007 148 Owners Mode wise break-up Total Thermal Nuclea r Hydro (Renewable) Res** Coal Gas Diesel Total Thermal MW ( % ) MW ( % ) MW ( % ) MW ( % ) MW ( % ) MW ( % ) State 1970 21.08
1.37 2097.92 22.45 0 3518.2 37.64 452.4 4.84 6068.52 Private 260 2.78 220 2.35 106.5 1.14 586.5 6.27
15.28 2014.6 Central 1072.67 11.48
11.48 190.9
Total 3302.67 35.34 220 2.35 234.42 2.51 3757.09 40.2 190.9 3518.2 37.64 1880.5 20.12 9346.69
12/3/2010 Infrastructure Policy 2007 149
RE Source Target MW Year wise proposed capacity addition 2009-10 2010-11 2011-12 2012-13 2013-14 Wind Power 2769 530 580 530 530 599 Mini and Small Hydro 500 100 100 100 100 100
281 56 56 56 56 57 Biomass/Bio-gas 500 100 100 100 100 100 Waste to Energy 50 10 10 10 10 10 Solar PV and Thermal 100 20 20 20 20 20 Total 4200 816 866 816 816 886
12/3/2010 Infrastructure Policy 2007 150
Total Inhabited village (2001 census) Villages electrified Un-electrified villages Numbers (%) 27481 27458 99.9 23