
SLIDE 1
PwC
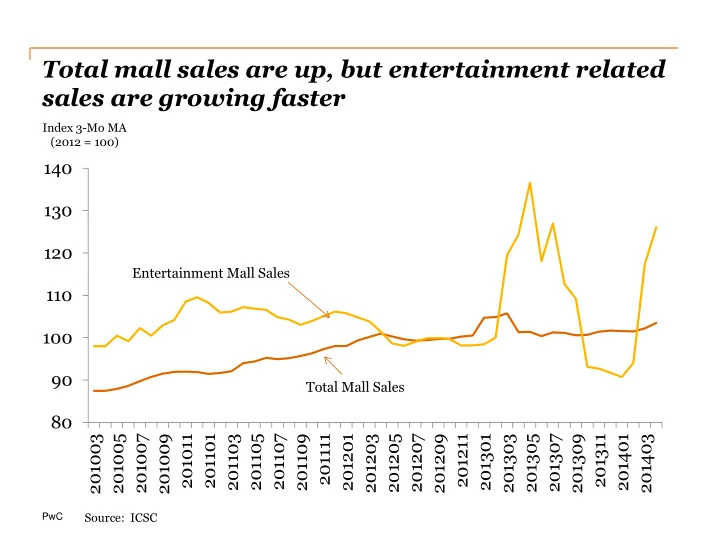
Total mall sales are up, but entertainment related sales are growing faster
80 90 100 110 120 130 140 201003 201005 201007 201009 201011 201101 201103 201105 201107 201109 201111 201201 201203 201205 201207 201209 201211 201301 201303 201305 201307 201309 201311 201401 201403
Entertainment Mall Sales
Index 3-Mo MA (2012 = 100)
Total Mall Sales
Source: ICSC