
SLIDE 1
Thermal expansion and magnetostriction measurements of CeCu6-xAux single crystals
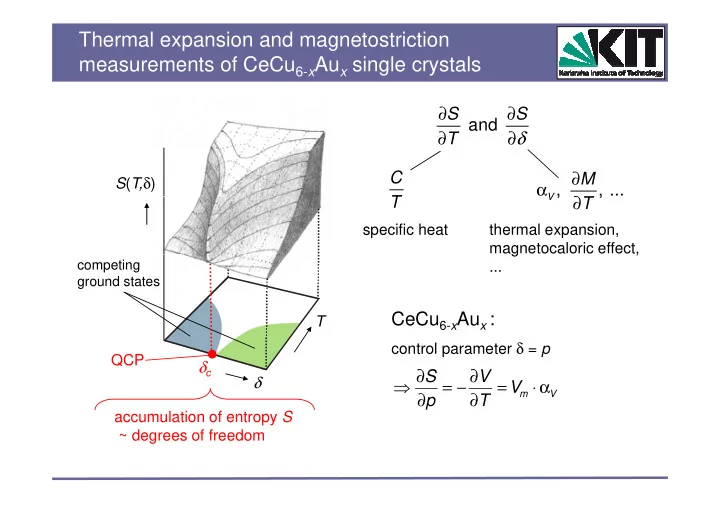
and S S T ∂ ∂ ∂ ∂δ
S(T,δ)
T ∂ ∂δ C T , , ...
V
M T ∂ α ∂ T , ,
V
T ∂
specific heat thermal expansion, magnetocaloric effect,
competing ground states
C C A
g , ... T δ QCP
CeCu6-xAux :
control parameter δ = p
V S ∂ ∂
δc δ accumulation of entropy S
V m