the world dairy situation
play

The World Dairy Situation Vronique Pilet, CNIEL, France Milwaukee, - PDF document

Annual Na(onal Workshop for Dairy Economists and Policy Analysts Session IV: Status and Opportunities for Dairy Sectors Around the World The World Dairy Situation Vronique Pilet, CNIEL, France Milwaukee,


  1. Annual ¡Na(onal ¡Workshop ¡for ¡Dairy ¡Economists ¡and ¡Policy ¡Analysts ¡ Session IV: Status and Opportunities for Dairy Sectors Around the World The World Dairy Situation Véronique Pilet, CNIEL, France Milwaukee, May 1, 2014 World dairy production (all categories included) 
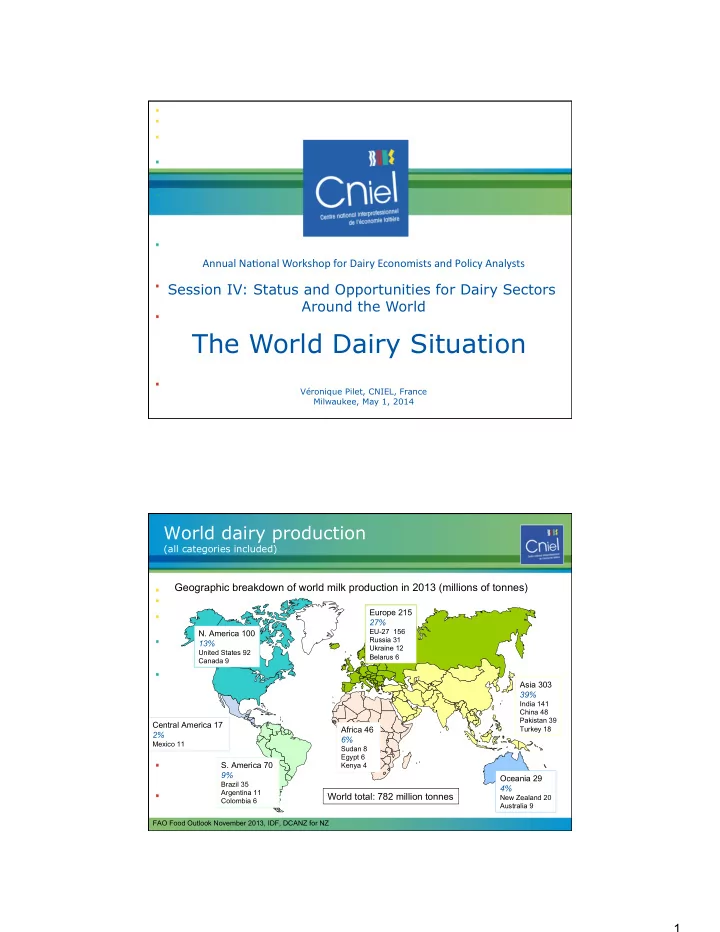
Geographic breakdown of world milk production in 2013 (millions of tonnes) Europe 215 27% EU-27 156 N. America 100 Russia 31 13% Ukraine 12 United States 92 Belarus 6 Canada 9 Asia 303 39% India 141 China 48 Pakistan 39 Central America 17 Africa 46 Turkey 18 2% 6% Mexico 11 Sudan 8 Egypt 6 S. America 70 Kenya 4 9% Oceania 29 Brazil 35 4% Argentina 11 World total: 782 million tonnes New Zealand 20 Colombia 6 Australia 9 FAO Food Outlook November 2013, IDF, DCANZ for NZ 1

  2. Regional dynamics Evolu(on ¡of ¡dairy ¡produc(on ¡(all ¡categories ¡included) ¡2008 ¡to ¡2013 ¡ Europe + 0 Mt North & Central America + 7 Mt Asia + 55 Mt Africa + 10 Mt South America + 13 Mt Oceania + 4 Mt World total: + 89 million tonnes CNIEL / IDF, FAO Food Outlook Mt: million tonnes Recent production trends by the major suppliers in 2013 Recent production tendencies among major suppliers of the world market EU - 27 United States Deliveries Production 12 months 2013: + 1.1% 12 months 2013: + 0.7% 2 months 2014: +4.7% 3 months 2014: +1.0% Australia Production Argentina 12 months 2013: -4.7% Deliveries 12 months 2013: -5.7% 2 months 2014: +2.5% 3 months 2014: +1.0% New Zealand Deliveries 12 months 2013: -1.5% 2 months 2014: +9.3% CNIEL / USDA, Dairy Australia, EU Commission, CLAL, ZMB 2

  3. World Dairy Leaders Ranking based on 2012 turnover (USD) Country 2010 2011 2012 Annual growth '11-12 1 Lactalis FR 12,5 17,5 20,2 + 15% 2 Nestlé CH 19,6 18,6 19,8 + 7% 3 Fonterra NZ 11,9 15,3 15,8 + 4% 4 Danone FR 12,9 15,6 15,0 - 4% 5 FrieslandCampina NL 11,9 13,4 13,2 - 1% 6 DFA US 9,8 13,0 12,1 - 7% 7 Dean Foods US 12,1 13,1 11,5 - 12% 8 Arla Foods DK 8,7 10,3 10,9 + 6% 9 Meiji Dairies JP 7,0 7,4 7,5 + 1% 10 Morinaga Milk Industry JP 6,8 7,4 7,2 - 3% 11 Saputo CA 5,8 6,8 7,2 + 4% 12 Yili CN 4,4 5,8 6,7 + 15% 13 Müller DE na na 6,0 14 Lala MX na na 6,0 15 Mengniu CN 4,5 5,8 5,7 - 1% 16 DMK DE 5,3 6,4 5,7 - 11% 17 Sodiaal FR 5,3 6,1 5,6 - 9% 18 Bongrain FR 4,7 5,5 5,2 - 5% 19 Land O'Lakes US 3,5 4,3 4,2 - 4% 20 Glanbia IE 3,4 4,4 3,9 - 12% 21 Kraft Foods US 7,0 7,7 3,8 - 50% 22 Agropur CA 3,2 3,7 3,7 - 1% 23 Schreiber US na na 3,5 5 24 Bel FR 3,2 3,5 3,4 - 3% 25 Tine NO 3,1 3,5 3,4 - 2% Geographical variations of dairy product consumption Apparent dairy product consumption levels in 2013 (kg per capita) Canada Russia 243 243 EU 286 USA Japan 70 China 41 275 Iran Algeria 107 147 India Mexico 109 116 Sudan Philippines 12 229 Brazil 178 Indonesia 13 World Australia 309 average: Less than 50 kg 100 to 200 kg 109 kg/capita Argentina 232 50 to 100 kg More than 200 kg CNIEL / IDF, FAO Food Outlook, PRB 3

  4. Dairy consumption: fast growing regions IDF, FAO Food Outlook World Trade IDF, FAO Food Outlook 4

  5. Demand is sustained on main markets Recent import tendencies on substantial markets Russia Imports* 12 months 2013 Butter : +20% Cheese : +3% United States Imports 12 months Japan 2013 Imports 12 months Cheese : -4% 2013 Caseins : -4% Cheese : +1% China Imports 12 months 2013 SMP : +40% WMP : +53% Brazil Whey : +15% Imports 12 months 2013 WMP : -23% Cheese : +14% Algeria Import 12 months 2013 SMP: +6% WMP: -25% *Russian imports do not account for volumes originating from Belarus NB: Evolution of imports based on volume CNIEL / Ubifrance, national customs Presence on the world market Recent export tendencies among major suppliers of the world market EU - 27 Exports: 12 months in 2013 Skim milk powder: -21% Whole milk powder: -3% United States Butter: +0% Exports: 12 months in 2013 Cheese: +3% Skim milk powder : +25% Whey: +5% Cheese : +22% New Zealand Exports: 12 months in 2013 Skim milk powder: + 0% Whole milk powder: +2% Argentina Butter: -3% Butter oil: +2% Exports: 12 months 2013 Cheese: -10% Whole milk powder : -10% Cheese : -6% Australia Exports: 12 months 2013 Skim milk powder : -29% Whole milk powder : -11% Cheese : +1% NB: Evolution of exports on a volume basis CNIEL / USDA, Dairy Australia, Commission, ZMB, Ubifrance, national customs 5

  6. World market prices still at high levels FOB price in Oceania US$ 1,000 / tonne up until April 2014 6 6 5 5 SMP 4 4 3 3 BUTTER 2 2 1 1 2009 2010 2011 2012 2013 2014 2009 2010 2011 2012 2013 2014 6 6 5 5 4 4 3 3 WMP CHEDDAR CHEESE 2 2 1 1 2009 2010 2011 2012 2013 2014 2009 2010 2011 2012 2013 2014 CNIEL / USDA Farmgate milk prices throughout the World € / 100 kg CNY/ litre 5 50 2013 2013 2014 2014 4 40 3 30 2012 2012 2 20 China Germany 1 10 0 0 Jan Feb Mar Apr May Jun Jul Aug Sep Oct Nov Dec Jan Feb Mar Apr May Jun Jul Aug Sep Oct Nov Dec USD / 100 kg USD / 100 kg NZD / 100 kg 60 75 2013 2014 2014 50 60 2013 40 2012 45 30 2012 30 20 New Zealand USA 15 10 0 0 Jan Feb Mar Apr May Jun Jul Aug Sep Oct Nov Dec Jan Feb Mar Apr May Jun Jul Aug Sep Oct Nov Dec NB: fat and protein content references differ from one country to another. CNIEL, ZMB, USDA, CLAL 6

  7. SUMMARY ¡ � Bad ¡ weather ¡ + ¡ High ¡ input ¡ prices ¡ had ¡ led ¡ to ¡ a ¡ low ¡ start ¡in ¡2013 ¡ � But ¡ global ¡ dairy ¡ produc(on ¡ is ¡ now ¡ rapidly ¡ rebounding ¡ � Dairy ¡ demand ¡ remains ¡ strong, ¡ esp. ¡ from ¡ emerging ¡ markets ¡ � Markets ¡ put ¡ under ¡ pressure ¡ and ¡ reached ¡ record ¡ levels ¡ � Next? ¡ � Seasonal ¡peak ¡in ¡Northern ¡hemisphere ¡ � End ¡of ¡quotas ¡in ¡Europe ¡ � Weather ¡& ¡sanitary ¡issues ¡ � ... ¡ Q & A 7

Download Presentation
Download Policy: The content available on the website is offered to you 'AS IS' for your personal information and use only. It cannot be commercialized, licensed, or distributed on other websites without prior consent from the author. To download a presentation, simply click this link. If you encounter any difficulties during the download process, it's possible that the publisher has removed the file from their server.

Recommend


More recommend