the value of genetics
play

The Value of Genetics Talk Outline Genetic Selection and how it - PDF document

Beef 2015 Presentation By Alf Collins Jnr The Value of Genetics Talk Outline Genetic Selection and how it works How we have achieved genetic gain at ALC What it means in $ value Id like to start with the three legged stool


  1. Beef 2015 Presentation By Alf Collins Jnr – The Value of Genetics Talk Outline  Genetic Selection and how it works  How we have achieved genetic gain at ALC  What it means in $ value I’d like to start with the three legged stool analogy. The first leg of the stool is represented by management . That’s management of the pro perty, herd, people, finance etc. The second leg is
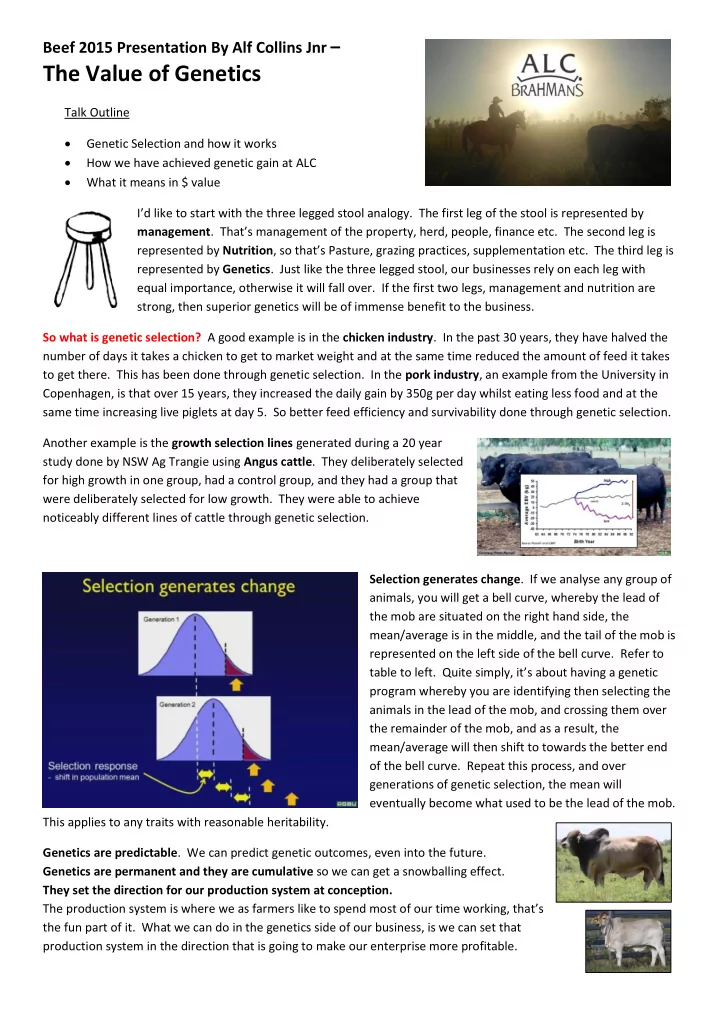
 represented by Nutrition , so that’s Pasture, grazing practices, supplementation etc. The third leg is represented by Genetics . Just like the three legged stool, our businesses rely on each leg with equal importance, otherwise it will fall over. If the first two legs, management and nutrition are strong, then superior genetics will be of immense benefit to the business. So what is genetic selection? A good example is in the chicken industry . In the past 30 years, they have halved the number of days it takes a chicken to get to market weight and at the same time reduced the amount of feed it takes to get there. This has been done through genetic selection. In the pork industry , an example from the University in Copenhagen, is that over 15 years, they increased the daily gain by 350g per day whilst eating less food and at the same time increasing live piglets at day 5. So better feed efficiency and survivability done through genetic selection. Another example is the growth selection lines generated during a 20 year study done by NSW Ag Trangie using Angus cattle . They deliberately selected for high growth in one group, had a control group, and they had a group that were deliberately selected for low growth. They were able to achieve noticeably different lines of cattle through genetic selection. Selection generates change . If we analyse any group of animals, you will get a bell curve, whereby the lead of the mob are situated on the right hand side, the mean/average is in the middle, and the tail of the mob is represented on the left side of the bell curve. Refer to table to left. Quite simply, it’s about having a genetic program whereby you are identifying then selecting the animals in the lead of the mob, and crossing them over the remainder of the mob, and as a result, the mean/average will then shift to towards the better end of the bell curve. Repeat this process, and over generations of genetic selection, the mean will eventually become what used to be the lead of the mob. This applies to any traits with reasonable heritability. Genetics are predictable . We can predict genetic outcomes, even into the future. Genetics are permanent and they are cumulative so we can get a snowballing effect. They set the direction for our production system at conception. The production system is where we as farmers like to spend most of our time working, that’s the fun part of it. What we can do in the genetics side of our business, is we can set that production system in the direction that is going to make our enterprise more profitable.

  2. Sire Selection is the major directional force that will change a herd. Clay Centre, Nebraska, documented the power of bull selection versus female selection over a 20 year trial using yearling weights. From this trial, through bull selection alone, they were able to gain 50kg/head. Heifer selection alone, resulted in only 5.5kg/head improvement. Bull plus heifer selection yielded 51kg of improvement. So what it determined, is that bull selection accounted for almost 90% of the total genetic improvement in yearling weights and that can apply for most traits of similar heritability. So that comes back to the old bell curve again. We need to identify the sires in the lead, crossing them over the females in the herd, moving the mean to the right. Recent CRC data for Brahmans, has shown us in ten years, it’s possible to:  Reduce re-breed speed in the Brahman breed by 3-4 months  Reduce age of puberty by 4-5 months  Increase weaning rate by 10-14% This can all be done with the right selection and if we want to . How do we do that? First we have to have clear goals of what is the most profitable animal for our business. Second , identify what key traits increase our profitability. Third , measure, record and analyse the key traits and turn them into Estimated Breeding Values (EBV’s). Fourth , use this information to select sires that will take us in the direction we want to go in. So that’s the information we need to use to find the bulls in the red part of our bell curve. Remember, sire selection is responsible for 90% of our genetic gain. Key traits that drive profit in a beef herd. Certainly in our herd and I think this applies to most beef herds in Northern Australia, 70% is coming from fertility/reproduction, 20% from growth and 10% from other traits. Other traits being carcass traits, colour, depending on regions market bias and fashion at the time. For those of you who don’t know what an EBV is, EBV’s are a key tool for selection . How is an EBV generated? Basically, as seedstock producers, we submit raw data, from individual animals, in the form of weights at 200, 400 and 600 days of age, scrotal size at 400 days of age, joining dates and birth dates, carcass information, along with pedigrees of the animals. This allows genetic comparisons of animals across groups, years and herds. Breedplan can then remove the non-genetic effects from different herds, paddocks, ages, age of dam etc. EBV ’ s allow selection across a balance of traits also. So they can take into account correlations between traits, for example, high 600 day weight is going to be correlated to a higher birth weight. Large scrotal size is correlated with favourable Days to Calving. Getting off the cattle for a bit, we have a couple of potential sires here pictured to the right, in the form of Sumo Wrestlers. You can tell by the body condition, the big guy is older and has been on the grain bin and the little fellow has been on the spinifex. Now how are we going to pick from these two, who is going to be the best sire to breed future sumo wrestlers? If we don’t have any performance data on either of them , then this would be hard to do. The big guy would be the obvious choice going by weight and looks but for all we know, he may be a big sook, with no heart and has never thrown his opposition out of the circle before and all his relatives have been the same. Therefore the likeliness of him being a champion wrestler is slim. The little guy however might have had a long line of champion wrestlers in his pedigree. If we had genetic analyses that took into account all known relatives performance (EBV ’ s), we could use this information to confidently back the little guy and his abilities to produce more champions, but we definitely cou ldn’t do that just by looking at them.

  3. EBV Accuracy to me is a very important. There is no point having a heap of fancy EBV’s that don’t mean anything. Obviously the more data, from more animals, across more groups and more herds, the higher the accuracy will be. Accuracy is reported by Breedplan alongside the EBV. If as a commercial producer you don’t wa nt to get wrapped up in individual traits, you can take advantage of the $ index’s. The Brahman breed has two market $ index’s; o ne for the Jap Ox market and one for Live Export market. So they put economic value on the production traits that effect that market, and put it into a $ figure, which is a very simple way to make selection across animals. ALC Herd 50 44 As you can see by the chart to the right, ALC Brahmans is performing quite well. The 40 ALC herd is positioned in the top 1% for both Jap Ox and Live Ex $ Index’s . Because we 40 get paid by weight in both these markets, it’s probably reasonable to think that growth 27 30 24 is the driver in this system. In our business fertility is the driver! Remember in the pie 20 graph that 70% of the profit in our business is driven by reproduction, and only 20% is Jap Ox $ Live Ex $ by growth. Index Index ALC Female Genetic Trend For Fertility Scrotal EBV'S 5.0 ALC compared with breed average 2 0.0 1.5 1996 2000 2004 2008 2012 2016 1 -5.0 0.5 -10.0 0 2000 2001 2002 2003 2004 2005 2006 2007 2008 2009 2010 2011 2012 2013 2014 -15.0 BREED AV EBV ALC EBV Breed Av. SS ALC SS The graph above shows ALC Days To Calving The graph above shows ALC Scrotal EBV ’ s Compared to the Brahman Breed. The lower the compared to the Brahman Breed. ALC is number, the faster the reproduction. You can see performing quite well and the genetic trend line is that the genetic trend is heading in the right heading in the right direction. direction. When we get these genetic trend lines heading in the right direction, it ’ s reassuring us that we are selecting the right animals (from the front of the bell curve) and we have a selection process taking the tail off therefore moving our mean in a positive direction for economic traits. ALC herd has been around breed average for growth over the years and at the moment we are just above breed average. The profit in our herd is driven by reproduction, with enough growth to hit our market windows and get there quickly. At ALC we ’ re certainly not interested in high growth, as growth equals intake. A big motor needs a lot of fuel! We are trying to stick with moderate, efficient cattle with fast growth with reproduction being the main driver .

Download Presentation
Download Policy: The content available on the website is offered to you 'AS IS' for your personal information and use only. It cannot be commercialized, licensed, or distributed on other websites without prior consent from the author. To download a presentation, simply click this link. If you encounter any difficulties during the download process, it's possible that the publisher has removed the file from their server.

Recommend


More recommend