SLIDE 1
Alex Kent and John Davies
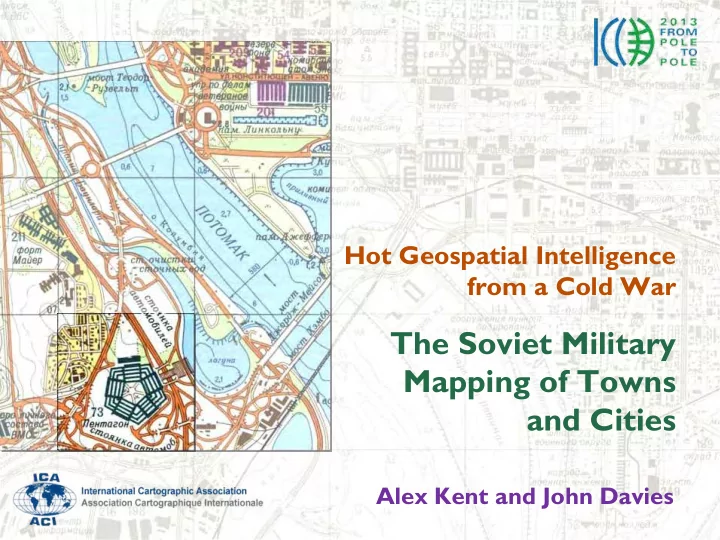
Hot Geospatial Intelligence from a Cold War
The Soviet Military Mapping of Towns and Cities
SLIDE 2 Context
(military topographic directorate of the Soviet Union) from WWII onwards, in parallel with the Soviet military topographic map series at six scales (from 1:25,000 to 1:1,000,000)
- Became available in the West, via Latvia, at ICC Köln, 1993
- Over 2,000
cities in 130 countries mapped at scales from 1:5,000 to 1:25,000 (mostly 1:10,000 or 1:25,000)
- Standard projection, ellipsoid, datum
and symbology, and usually printed on sheets larger than A0
SLIDE 3
cities mapped, at least
- nce, from 1950 on
- Three scales (1:5,000,
1:10,000 and 1:25,000)
SLIDE 4
Blackburn, 1974 (1 sheet, 1:10,000)
SLIDE 5
London, 1985 (4 sheets, 1:25,000)
SLIDE 6
Belfast, 1964 (1 sheet, 1:10,000)
SLIDE 7
Dover, 1940 (German Planheft, 1:10,000) Dover, 1974 (VTU, 1:10,000)
SLIDE 8
Pembroke, 1950 (VTU, 1:10,000) Pembroke, 1953 (OS, 1:10,560)
SLIDE 9 Observations
topographic detail, with strategic buildings/objects delineated, identified and classified
- Production quality is consistently high
- Local maps and directories used less, with greater reliance
- n satellite imagery (e.g. Zenit program of ‘cartographic’
satellites) from the early 1970s
- Some data also gathered by field observation
(e.g. the clearance height under bridges over rivers)
SLIDE 10
Cairo, 1972 (4 sheets, 1:25,000)
SLIDE 11
Washington, D.C., 1975 (4 sheets,
SLIDE 12
San Diego, 1980 (4 sheets, 1:25,000)
SLIDE 13
Port‐au‐Prince, 1983 (1 sheet, 1:10,000)
SLIDE 14
Mecca, 1980 (2 sheets, 1:10,000)
SLIDE 15
Sydney, 1984 (4 sheets, 1:25,000)
SLIDE 16
Chatham, 1984 (2 sheets, 1:10,000)
SLIDE 17
San Francisco, 1980 (8 sheets, 1:25,000)
SLIDE 18
Halifax, 1975 (1 sheet, 1:10,000)
SLIDE 19
Halifax, 1989 (1 sheet, 1:10,000)
SLIDE 20
Maribor, 1975 (1 sheet, 1:10,000) VTU City Plan
SLIDE 21
Maribor, 1993 (1 sheet, 1:20,000) NIMA City Graphic
SLIDE 22 Some Avenues for Future Research
are the plans, in terms of both spatial positioning and completeness/classification?
- How do the Soviet plans compare with contemporary
military plans produced by other countries?
- Can the design
- f the Soviet plans provide useful lessons
when creating new maps, particularly in presenting a high amount of geographical information?
SLIDE 23
Kent, A.J. and Davies, J.M. (2013) “Hot geospatial intelligence from a Cold War: The Soviet military mapping of towns and cities” CaGIS 40 (3) pp.248-253.
alexander.kent@canterbury.ac.uk john@jomidav.com
Thank you!