SLIDE 1
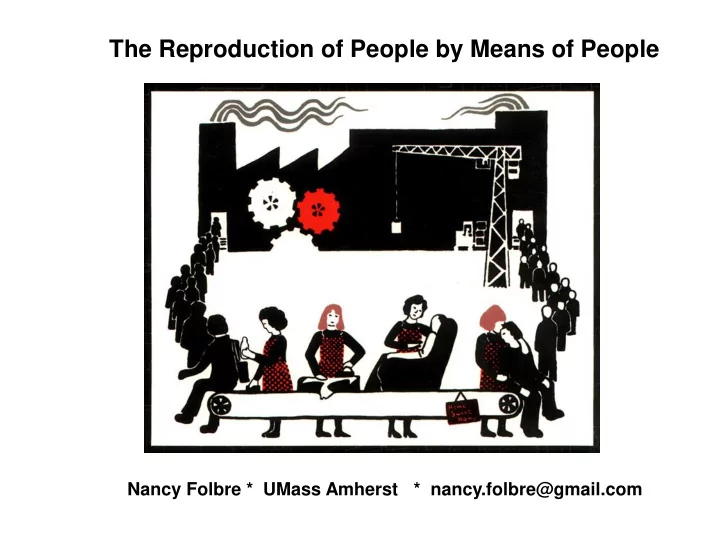
The Reproduction of People by Means of People
Nancy Folbre * UMass Amherst * nancy.folbre@gmail.com
SLIDE 2 We need an accounting system that allows us to measure the value of non-market work, intra-family transfers, and net taxes (in addition to market income and wealth)
SLIDE 3
- Some background/intellectual history.
- One equation, several policy-relevant
applications.
- Potential data sources and examples
- f empirical research
SLIDE 4
Economic theory has generally treated “the family” as a realm of altruism, in contrast to “the market,” a realm of self-interest. Distribution within the family remained, until recently, a kind of “black box” for economic theory. Treatment of government “transfer” payments similar—a realm of “consumption” rather than “investment.”
SLIDE 5
SLIDE 6
John Locke and the Labor Theory of Value
Every man should have control over the products of his own labor. Every man should enjoy “self-ownership” or autonomy. But what if men are themselves produced?
SLIDE 7
Piero Sraffa The Production of Commodities by Means of Commodities, 1960
Labor as the only “non-produced” commodity.
SLIDE 8
Workers and Robots
Imagine that corporations do not hire workers but purchase robots that require new batteries every week. The purchase price of a robot would be at least as high as the costs of producing that robot. But what if some people were willing to produce robots for free, because they enjoyed doing so? Then employers would need only pay for the batteries that the robots require— “wages.”
SLIDE 9 The “reproduction of labor power,” like the “reproduction
- f nature” –not necessarily
MOTIVATED by economic
them. The value of non-market assets and services can be approximated by the cost of available substitutes for them.
Parents, Mothers and Mother Nature
SLIDE 10
The Paradox of Human Capitalism
Human capital can win a high rate of return in a competitive capitalist economy. But much effort devoted to the production and maintenance of human capital is poorly rewarded by the market. Could conceptualize this as an “externality” or a “property-rights” or an “incomplete markets” problem. Need for a more systematic approach.
SLIDE 11
BUS
USIN INESS ESSES ES
HOUSEHOL
USEHOLDS
expenditures
The Conventional Circular Flow
GOVERN ERNMENT NT
taxes services taxes services income transfers
SLIDE 12 GOVERNMENT HOUSEHOLDS BUSINESSES
WOMEN MEN CHILDREN time money money time money time
A Revised Circular Flow
Red arrows = market transactions Green arrows = family/community transactions Blue arrows = spillovers/transfers to both nature and community
SLIDE 13
Time Devoted to Household Work Roughly Equivalent to Market Work
SLIDE 14
Measuring and Valuing Time Devoted to Non-Market Work
Not because non-market work is great.
SLIDE 15
Not succumbing to commodity fetishism..
SLIDE 16
Not an act of economic imperialism.
SLIDE 17
Non-market work, intra-family transfers, and government transfers are all large relative to market income. It’s an accounting problem.
SLIDE 18
Each individual i has total income Yi equal to some function of time devoted to market and non-market work, the wages and shadow wages of these activities, net transfers from other family members, net transfers from government (leave out income from capital and net transfers of unpriced environmental services, and for now just treat it as a simple additive function). Let wi = market wage for individual i whi = estimate of hourly value of household work Mi = hours of market work Hi =hours of household work Fi = net transfers from family members (money and value of time) Gi = net transfers from government (money and value of time)
Yi = wiMi + whiHi + Fi + Gi NOTE MAJOR CHANGES OVER LIFECYCLE!
SLIDE 19
Policy Relevant Example 1:
Measuring Living Standards
Compare two married couple families with two children under the age of 4. Both couples earn the same annual market income of $30,000. Ignore taxes, benefits and intrafamily transfers In family A, a full-time wage earner brings home $30,000 and provides about 10 hours per week of household work; a full-time caregiver devotes 40 hours per week to household work. Total household work=50 hours. In family B, both adults work full-time and each brings home $15,000 per year, and each devotes about 15 hours per week to unpaid family work. Total household work=30 hours Which family has the higher living standard?
Y = wM + whH + F + G
The red term is almost certainly bigger for family A, because H is 20 hours per week greater.
SLIDE 20
Policy Relevant Example 2:
Trends in Income Inequality
Has women’s entrance into paid employment over the last fifty years tended to increase or decrease family income inequality? Typically, women’s contribution to family income is set at zero if they have no market earnings. Because there is far less variation in the estimated value of family work than in women’s wages, measures of “extended income” (market income plus imputed value of family work) are far more equal than measures of market income. It is likely that a measure of inequality over time based on “extended income” shows an even stronger trend toward inequality than one based on market income alone.
Yi = wiMi + whiHi + Fi + Gi Variance of red term smaller than variance of blue term.
SLIDE 21 Policy Relevant Example 3:
Gender Empowerment Measures
United Nations Human Development Report offers many measures of the position of women relative to men, based on factors such as women’s relative earnings, their participation in professional and managerial
- ccupations, and their representation in government.
What’s missing: changes in the number of dependents (young children and elderly) that women are supporting relative to men.
Yi = wiMi + whiHi + Fi + Gi
As women’s market income goes up, they become more likely to become single heads of household. The more dependents they are supporting the larger (and more negative) the Fi term.
SLIDE 22 Policy Relevant Example 4:
Tax Freedom Day vs. Tax Payback Year
If, starting on January 1, you sent all your earnings to the government to pay your estimated taxes for the coming year, on what day of the year would you finally achieve “freedom” from this enslavement? Taxes represent slightly less than a third of family income; therefore “Tax Freedom Day” comes about one third of the way through the year, sometime in April. Consider instead “Tax Payback Year”—add up all the public resources spent on you until age 21, treating them as a loan that you start paying back at 3% interest (like a mortgage). Your monthly tax contributions represent your monthly
- payment. How long before you have paid off the principal and the interest on this
loan? (Answer: on average, about 17 years).
Yi = wiMi + whiHi + Fi + Gi
Tax Freedom Day considers only taxes; Gi above includes taxes net of benefits
- ver a period of years (lifetime measure most appropriate).
SLIDE 23
Policy Relevant Example 5: Social Security and Intergenerational Transfers
Yi = wiMi + whiHi + Fi + Gi
If Social Security and Medicare benefits are cut for the older generation, working-age families may pay lower net taxes, so Gi becomes larger for them. But if they must spend more to help pay their elderly parents’ bills, Fi will become smaller—and may also affect the size of their transfers to children. In general, families probably spend more on children than they would if they also had to help support their elderly members. Spending on Social Security and Medicare is sometimes described as Intergenerational “theft” because of the relatively high percentage of government spending devoted to the elderly.
SLIDE 24
Redefining Individual Consumption and Investment
Ci = Yi - Ii All spending on children and young adults is investment in human capital. (By conventional measures, not even educational expenditures are treated as investment, despite widespread use of the rhetoric of “investment in human capital” ) Individual consumption (Ci) =difference between individual income (Yi )and investment (Ii). including spending on children.
SLIDE 25
Policy Relevant Example 6:
Family (and Government Spending) on Children
Spending on children offers a future payoff to children themselves and society as a whole—shifts debate away from humanitarian concerns about child poverty to economic efficiency concerns. Some minimal level of investment in children is necessary to prevent waste of sunk costs—helps make a case for public assistance and provision to children.
SLIDE 26 Some Empirical Applications
- CDS-PSID—estimates of the replacement cost of direct and indirect
care for children, compared to the extra consumption expenditures Total costs more than 2 times greater than money See Valuing Children: Rethinking the Economics of the Family
- ATUS—estimates of the value of women’s and men’s unpaid childrearing
services compared to their earned income and value of non-child related housework.
- ATUS—comparison of living standards of elderly men living alone
compared to those living with spouses. In money terms, single elderly men have approximately the same money income, but much lower household production and care services. My own work:
SLIDE 27
Other Research: U.S. Health and Retirement Survey (HRS): studies of transfers of time and money to older generation. Ron Lee and the National Transfer Accounts project: http://www.ntaccounts.org/web/nta/show/
SLIDE 28
Thanks for your attention!
SLIDE 29
SLIDE 30