
SLIDE 1
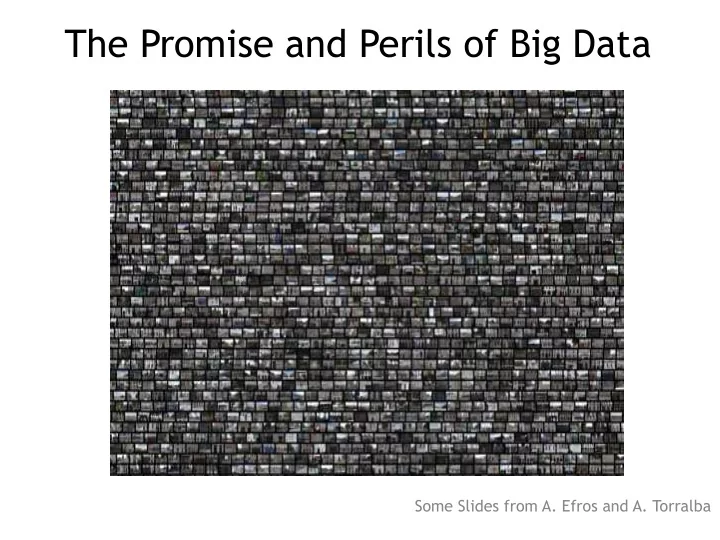
The Promise and Perils of Big Data
Some Slides from A. Efros and A. Torralba
The Promise and Perils of Big Data Some Slides from A. Efros and A. - - PowerPoint PPT Presentation
The Promise and Perils of Big Data Some Slides from A. Efros and A. Torralba Why do we need data? Most problems in vision are ambiguous and hard. 2D -> 3D Segmentation/Edges So, how do we solve these problems? Magic of data !
Some Slides from A. Efros and A. Torralba
Number of training samples 1 10 102 103 104 106-7 Extrapolation problem Generalization Transfer learning Interpolation problem Correspondence Finding the differences
1010 Datasets before 2012 Current Datasets
“Basically, my recollection is that we just separated the pictures into distinct thematic categories: e.g. cars, animals, single-person, 2- people, plants, etc.) Only a few slides were selected which fell into each category, and they were visually distinct.” According to Standing
Standing (1973) 10,000 images 83% Recognition What we know… What we don’t know…
Sparse Details Dogs Playing Cards “Gist” Only Highly Detailed
… people can remember thousands
… what people are remembering for each item?
High Fidelity Visual Memory is possible (Hollingworth 2004) Slide by Aude Oliva
Showed 14 observers 2500 categorically unique objects 1 at a time, 3 seconds each 800 ms blank between items Study session lasted about 5.5 hours Repeat Detection task to maintain focus 1-back Followed by 300 2-alternative forced choice tests 1024-back Slide by Aude Oliva
Slide by Aude Oliva
how far can we push the fidelity of visual LTM representation ?
Same object category, different instance Slide by Aude Oliva
how far can we push the fidelity of visual LTM representation ?
Same object, different states Slide by Aude Oliva
92%
Replication of Standing (1973) Slide by Aude Oliva
92% 88% 87% Slide by Aude Oliva
Human performances for n = 1024
Power law (r2=.988) Quadratic (r
2=.988) Brady, Konkle, Alvarez, Oliva (submitted)
Slide by Aude Oliva
images 1972
1 images
1 images
Marr, 1976
2-4 images
2-4 images In 1996 DARPA released 14000 images, from over 1000 individuals.
In 2007, the twenty object classes that have been selected are: Person: person Animal: bird, cat, cow, dog, horse, sheep Vehicle: aeroplane, bicycle, boat, bus, car, motorbike, train Indoor: bottle, chair, dining table, potted plant, sofa, tv/monitor
2-4 images
5 images
Griffin, Holub, Perona, 2007 Fei-Fei, Fergus, Perona, 2004
5 images
Z.Y . Yao, X. Yang, and S.C. Zhu, 2007
B.C. Russell, A. Torralba, K.P. Murphy, W.T. Freeman, IJCV 2008
Labelme.csail.mit.edu Tool went online July 1st, 2005 530,000 object annotations collected
5 images
Person 7 12 21 Dog 16 28 52 Bird 13 37 168 Chair 7 10 15 Street lamp 5 9 15 House 5 7 12 Motorbike 12 22 36 Boat 6 9 14 Tree 11 20 36 Mug 6 8 11 Bottle 7 8 11 Car 8 15 22
25% 50% 75% 25% 50% 75% Average labeling quality
… things do not always look good…
Object statistics Scene statistics How representative of the visual world is it?
5 images
6-7 images Things start getting out of hand
Luis Von Ahn and Laura Dabbish 2004
Russell, Torralba, Freeman, 2005
Bileschi, Poggio, 2006
Perona et al, 2007
2006, 2007
Song-Chun Zhu et al, 2007
Torralba, Fergus, Freeman, 2007
6-7 images
75.000 non-abstract nouns from WordNet 7 Online image search engines Google: 80 million images And after 1 year downloading images
. Freeman. PAMI 2008
6-7 images
~105+ nodes ~108+ images shepherd dog, sheep dog German shepherd collie animal
Deng, Dong, Socher, Li & Fei-Fei, CVPR 2009
6-7 images
Alexander Sorokin, David Forsyth, "Utility data annotation with Amazon Mechanical Turk", First IEEE Workshop on Internet Vision at CVPR 08.
Labeling for money
6-7 images
8-11 images
Number of images on my hard drive: 104 Number of images seen during my first 10 years: 108
(3 images/second * 60 * 60 * 16 * 365 * 10 = 630720000)
Number of images seen by all humanity: 1020
106,456,367,669 humans1 * 100 years * 3 images/second * 60 * 60 * 16 * 365 =
1 from http://www.prb.org/Articles/2002/HowManyPeopleHaveEverLivedonEarth.aspx
Number of all 32x32 images: 107373
256 32*32*3 ~ 107373
PASCAL Number of samples
window
S1 S2 S3 S4 S5 S6 S7 S8 S9 S1 S2 S3 S4 S5 S2 S3 S4 S5 S6 S3 S4 S5 S6 S7 S4 S5 S6 S7 S8 S5 S6 S7 S8 S9 Slide by Jaime Carbonell
Flooding Set
T3-a T3-b T3-c T4-a T4-b T4-c T4-d T4-e T5-a T6-a T6-b T6-c
each source word or phrase
Source Word-String
T2-a T2-b T2-c T2-d
Target Word Lists
S2 S3 S4 S5 S6 Inflected Bilingual Dictionary
Slide by Jaime Carbonell
each group
– Words or phrases can be in any order – Ignore function words in initial step (T5 is a function word in this example)
T2-a T2-b T2-c T2-d T3-a T3-b T3-c T4-a T4-b T4-c T4-d T4-e T5-a T6-a T6-b T6-c
Flooding Set
Slide by Jaime Carbonell
T(x) T(x) T(x) T(x) T(x) T(x) T(x) T(x) T3-b T(x) T2-d T(x) T(x) T6-c T(x) T(x) T(x) T(x) T(x) T(x) T(x) T(x) T(x) T(x) T(x) T(x) T(x) T(x) T(x) T(x) T(x) T(x) T(x) T(x) T(x) T(x) T(x) T(x) T(x) T(x) T(x) T(x)
T2-a T2-b T2-c T2-d T3-a T3-b T3-c T4-a T4-b T4-c T4-d T4-e T5-a T6-a T6-b T6-c
Flooding Set Target Corpus
T(x) T(x) T(x) T(x) T(x) T(x) T(x) T(x) T3-b T(x) T2-d T(x) T(x) T6-c T(x) T(x) T(x) T(x) T(x) T(x) T(x) T(x) T(x) T(x) T(x) T(x) T(x) T(x) T(x) T(x) T(x) T(x) T(x) T(x) T(x) T(x) T(x) T(x) T(x) T(x) T(x) T(x) T3-b T(x) T2-d T(x) T(x) T6-c
Target Candidate 1
Slide by Jaime Carbonell
T(x) T(x) T(x) T(x) T(x) T(x) T(x) T(x) T(x) T(x) T(x) T(x) T(x) T(x) T(x) T(x) T(x) T(x) T(x) T(x) T(x) T(x) T(x) T(x) T(x) T(x) T(x) T(x) T(x) T(x) T(x) T(x) T(x) T(x) T(x) T(x) T(x) T(x) T(x) T(x) T(x) T(x)
T2-a T2-b T2-c T2-d T3-a T3-b T3-c T4-a T4-b T4-c T4-d T4-e T5-a T6-a T6-b T6-c
Flooding Set Target Corpus
T(x) T(x) T(x) T(x) T(x) T(x) T(x) T(x) T(x) T(x) T(x) T(x) T(x) T(x) T(x) T(x) T(x) T(x) T(x) T(x) T(x) T(x) T(x) T4-a T6-b T(x) T2-c T3-a T(x) T(x) T(x) T(x) T(x) T(x) T(x) T(x) T(x) T(x) T(x) T(x) T(x) T(x) T4-a T6-b T(x) T2-c T3-a
Target Candidate 2
Slide by Jaime Carbonell
T(x) T(x) T(x) T(x) T(x) T(x) T(x) T(x) T(x) T(x) T(x) T(x) T(x) T(x) T(x) T(x) T(x) T(x) T(x) T(x) T(x) T(x) T(x) T(x) T(x) T(x) T(x) T(x) T(x) T(x) T(x) T(x) T(x) T(x) T(x) T(x) T(x) T(x) T(x) T(x) T(x) T(x)
T2-a T2-b T2-c T2-d T3-a T3-b T3-c T4-a T4-b T4-c T4-d T4-e T5-a T6-a T6-b T6-c
Flooding Set Target Corpus
T(x) T(x) T(x) T(x) T(x) T(x) T(x) T(x) T(x) T(x) T(x) T(x) T(x) T(x) T(x) T(x) T(x) T(x) T(x) T(x) T(x) T(x) T(x) T(x) T(x) T(x) T(x) T(x) T3-c T2-b T4-e T5-a T6-a T(x) T(x) T(x) T(x) T(x) T(x) T(x) T(x) T(x) T3-c T2-b T4-e T5-a T6-a
Target Candidate 3 Reintroduce function words after initial match (e.g. T5)
Slide by Jaime Carbonell
Scoring
– Proximity (minimize extraneous words in target n-gram ≈ precision) – Number of word matches (maximize coverage ≈ recall)) – Regular words given more weight than function words – Combine results (e.g., optimize F1 or p-norm or …)
T3-b T(x) T2-d T(x) T(x) T6-c T4-a T6-b T(x) T2-c T3-a T3-c T2-b T4-e T5-a T6-a
Proximity 3rd 1st 1st Word Matches 3rd 2st 1st “Regular” Words 3rd 1st 1st Total Scoring 3rd 2nd 1st
Slide by Jaime Carbonell
T3-b T(x3) T2-d T(x5) T(x6) T6-c T4-a T6-b T(x3) T2-c T3-a T3-c T2-b T4-e T5-a T6-a T(x2) T4-a T6-b T(x3) T2-c T(x1) T2-d T3-c T(x2) T4-b T(x1) T3-c T2-b T4-e T6-b T(x11) T2-c T3-a T(x9) T2-b T4-e T5-a T6-a T(x8) T6-b T(x3) T2-c T3-a T(x8)
Word-String 1 Candidates Word-String 2 Candidates Word-String 3 Candidates
T(x2) T4-a T6-b T(x3) T2-c T4-a T6-b T(x3) T2-c T3-a T6-b T(x3) T2-c T3-a T(x8) T3-c T2-b T4-e T5-a T6-a T3-b T(x3) T2-d T(x5) T(x6) T6-c T3-b T(x3) T2-d T(x5) T(x6) T6-c T4-a T6-b T(x3) T2-c T3-a T(x1) T3-c T2-b T4-e T3-c T2-b T4-e T5-a T6-a T2-b T4-e T5-a T6-a T(x8)
Slide by Jaime Carbonell
T(x1) T3-c T2-b T4-e T3-c T2-b T4-e T5-a T6-a T2-b T4-e T5-a T6-a T(x8) T(x2) T4-a T6-b T(x3) T2-c T4-a T6-b T(x3) T2-c T3-a T6-b T(x3) T2-c T3-a T(x8) T(x2) T4-a T6-b T(x3) T2-c T3-a T(x8) T(x1) T3-c T2-b T4-e T5-a T6-a T(x8)
Alternative 1 Alternative 2
Slide by Jaime Carbonell
a United States soldier died and two others were injured Monday a United States soldier United States soldier died soldier died and two others died and two others were injured two others were injured Monday
N-grams generated from Flooding
Flooding N-gram fidelity Overlap Long range fidelity
N-grams connected via Overlap
Slide by Jaime Carbonell
Brute Force Vision: Find that needle in the haystack and disregard the rest (a.k.a. kNN) See what different subsets
.Freeman. PAMI 2008
.Freeman. PAMI 2008
Grayscale input High resolution Colorization of input using average
.Freeman. 2008
Instead of using objects labels, the web provides other kinds of metadata associate to large collections of images Hays & Efros. CVPR 2008 20 million geotagged and geographic text-labeled images
Hays & Efros. CVPR 2008
Instead, generate proposals using millions of images Hays, Efros, 2007 Input 16 nearest neighbors (gist+color matching)
22,000 LabelMe scenes
Hays, Efros, Siggraph 2006 Russell, Liu, Torralba, Fergus, Freeman. NIPS 2007
Russell, Liu, Torralba, Fergus, Freeman. NIPS 2007
Russell, Liu, Torralba, Fergus, Freeman. NIPS 2007
Russell, Liu, Torralba, Fergus, Freeman. NIPS 2007
Russell, Liu, Torralba, Fergus, Freeman. NIPS 2007
Russell, Liu, Torralba, Fergus, Freeman. NIPS 2007
Slide by Antonio Torralba
Slide by Antonio Torralba
83
Medici Fountain, Paris
84
85
86
Medici Fountain, Paris (winter)
87
88
89
90
91
92
93
94
Top Matches Input Query
95
Top Matches Input Query
96
Top Matches Input Query
97
Input Query Important Parts
98
Top Matches Input Query
99
100
Top Matches Input Query
101
102
Input Painting Top Matches
103
Input Painting Top Matches
Liu, Yuen, Torralba, Sivic, Freeman. ECCV 08
128 dimensions/pixel
SIFT Visualization: map 128 dimensions in 3D color space
Query Best match Annotation of best match Warped best match to query Parsing result Ground truth
Liu, Yuen, Torralba. CVPR 2009; Yuen, Torralba. ECCV 2010
Prediction
Sparse Detections Input Image
Ramanan, Forsyth, Zisserman, 2004
David C. Lee, Martial Hebert, Takeo Kanade, CVPR’09
David C. Lee, Martial Hebert, Takeo Kanade, CVPR’09
Structure Objects Wall appearance modeling David C. Lee, Martial Hebert, Takeo Kanade, CVPR’09
images from hormel corp.
Slide by Dave Thompson
images from www.golfswingphotos.com
Slide by Dave Thompson
Slide by Dave Thompson
Slide by Dave Thompson
Slide by Dave Thompson
Classes sorted by frequency
The first 9 objects account for 50% of all training examples 17 classes with more than 300 examples 109 classes with less than 50 examples
200 categories
~ Zipf’s law
Classes sorted by frequency
chair Swivel chair armchair Deck chair
Salakhutdinov, Torralba, and Tenenbaum, CVPR, 2011
bus van truck car Classes sorted by frequency
Salakhutdinov, Torralba, and Tenenbaum, CVPR, 2011
Google mugs Mugs from LabelMe
__ Caltech 101 __ Caltech 256 __ MSRC __ UIUC cars __ Tiny Images __ Corel __ PASCAL 2007 __ LabelMe __ COIL-100 __ ImageNet __ 15 Scenes __ SUN’09
classifiers
image features
(chance is 8%)
Classifier trained on MSRC cars
MSRC Caltech101 ImageNet PASCAL LabelMe SUN
AP Number training examples Training on PASCAL Adding more PASCAL Adding more from LabelMe Adding more from Caltech 101