The Problem In May 2012, Kenyan newspapers reported that 73% of the - - PowerPoint PPT Presentation

the problem
SMART_READER_LITE
LIVE PREVIEW

The Problem In May 2012, Kenyan newspapers reported that 73% of the - - PowerPoint PPT Presentation

The Problem In May 2012, Kenyan newspapers reported that 73% of the population in the rural areas [now had] access to electricity," with access defined as living within 1.2km of a low-voltage line. Opportunity for Last Mile


slide-1
SLIDE 1

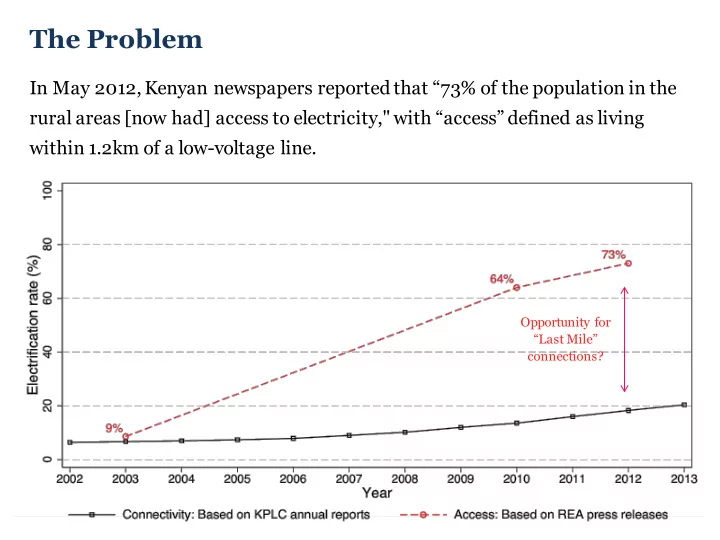
In May 2012, Kenyan newspapers reported that “73% of the population in the rural areas [now had] access to electricity," with “access” defined as living within 1.2km of a low-voltage line.

Opportunity for “Last Mile” connections?

The Problem

slide-2
SLIDE 2

Field experiment

In September 2013, we partnered with Kenya’s Rural Electrification Authority (REA) to identify a sample

  • f 150 rural “transformer

communities” in Western Kenya. We followed a selection procedure to ensure that our sample is representative of “under grid” communities in rural Busia and Siaya counties.

Rural Electrification 2

slide-3
SLIDE 3

Example of a “transformer community”

Transformer & 600 meter radius

T

Legend

Households (scaled by household size) Businesses Public facilities (e.g. schools, health) Electrified households Electrified businesses Electrified public facilities

Rural Electrification 3

slide-4
SLIDE 4

Rural Electrification 4

slide-5
SLIDE 5

Despite large investments in the rural grid, electrification rates remain low.

slide-6
SLIDE 6

Half of the unconnected households in the study are “under grid.”

slide-7
SLIDE 7

Experimental design

Study sample Ÿ Randomly sampled 2,289 unconnected and 215 connected households across all 150 communities for main sample Census sample Ÿ 150 “transformer communities” in Western Kenya in partnership with REA Ÿ Geo-tagged universe of 12,001 unconnected HHs within 600 meters of a transformer High subsidy Price: $0

Ÿ 25 communities

Ÿ 380 unconnected households Medium subsidy Price: $171

Ÿ 25 communities

Ÿ 379 unconnected households Low subsidy Price: $284

Ÿ 25 communities

Ÿ 380 unconnected households Control group Price: $398

Ÿ 75 communities

Ÿ 1150 unconnected households Rural Electrification 7

slide-8
SLIDE 8
  • 1. What is the demand for grid connections?

Key Finding 1

Rural Electrification 8

slide-9
SLIDE 9

Willingness to pay for electricity connections

  • Q1. Would you be willing to pay [AMOUNT] KSh for an electricity connection?
slide-10
SLIDE 10

Willingness to pay for electricity connections (cont’d)

  • Q2. Imagine that you were offered an electricity connection at this price today, and

you were given 6 weeks to complete the payment. Would you accept the offer?

slide-11
SLIDE 11

What is the take up rate at Ksh 15,000?

  • A. 10%
  • B. 20%
  • C. 30%
  • D. 40%
  • E. 50%

Rural Electrification 11/36

slide-12
SLIDE 12

What is the take up rate at Ksh 25,000?

  • A. 10%
  • B. 20%
  • C. 30%
  • D. 40%
  • E. 50%

Rural Electrification 12/36

slide-13
SLIDE 13

Stated willingness to pay results

Rural Electrification 13

slide-14
SLIDE 14
  • 1. What is the demand for grid connections?

Demand declines rapidly with price and is lower than expected by policymakers (or us).

  • 2. Are there economies of scale in mass connections?

Key Findings (cont’d)

Rural Electrification 14

slide-15
SLIDE 15

Rural Electrification 15

slide-16
SLIDE 16

Rural Electrification 16

slide-17
SLIDE 17

Rural Electrification 17

The above figures plot budgeted estimates of the average total cost (ATC) per connection per various levels of community coverage (i.e., electrification) for both sample and design communities.

slide-18
SLIDE 18
  • 1. What is the demand for grid connections?

Demand declines rapidly with price and is lower than expected by policymakers (or us).

  • 2. Are there economies of scale in mass connections?

Using actual electrical utility cost data, strong evidence for declining average costs in the range of coverage in the sample (0-40%), up to 100% coverage in communities with designs.

  • 3. What are the welfare implications of a mass household

electrification program?

Results (cont’d)

Rural Electrification 18

slide-19
SLIDE 19

Rural Electrification 19

slide-20
SLIDE 20

Free mass electrification case

à Total Cost 4.5x Consumer Surplus à Need welfare gains of $511 per household

Rural Electrification 20

slide-21
SLIDE 21
  • 1. What is the demand for grid connections?

Demand declines rapidly with price and is lower than expected by policymakers (or us).

  • 2. Are there economies of scale in mass connections?

Using actual electrical utility cost data, strong evidence for declining average costs in the range of coverage in the sample (0-40%), up to 100% coverage in communities with designs.

  • 3. What are the implications of a mass household electrification

program?

The price that a consumer is willing to pay for an electricity connection if far less than the actual cost of connecting that consumer.

Results (cont’d)

Rural Electrification 21

slide-22
SLIDE 22

Comprehensive socio-economic impacts of electrification

Outcomes of interest:

  • A. Children’s education
  • G. Household roster
  • B. Health
  • H. Land and agriculture
  • C. Political awareness
  • I. Energy
  • D. Social cohesion
  • J. Markets
  • E. Household assets
  • K. Time use
  • F. Employment
slide-23
SLIDE 23

Thank you

Rural Electrification 23

fmeyo@poverty-action.org & esmith@poverty-action.org