
SLIDE 1
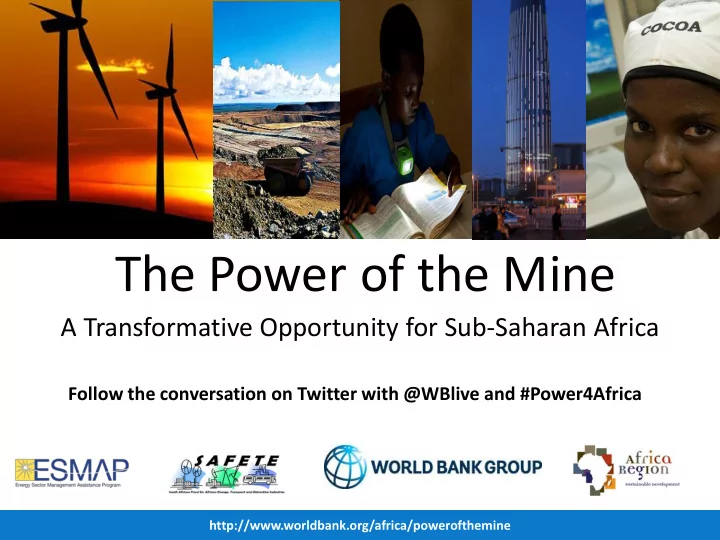
A Transformative Opportunity for Sub-Saharan Africa
The Power of the Mine
http://www.worldbank.org/africa/powerofthemine
Follow the conversation on Twitter with @WBlive and #Power4Africa
The Power of the Mine A Transformative Opportunity for Sub-Saharan - - PowerPoint PPT Presentation
The Power of the Mine A Transformative Opportunity for Sub-Saharan Africa Follow the conversation on Twitter with @WBlive and #Power4Africa http://www.worldbank.org/africa/powerofthemine Africas power deficit is crippling despite huge energy
http://www.worldbank.org/africa/powerofthemine
Follow the conversation on Twitter with @WBlive and #Power4Africa
2
Hydro potential: 400GW Geothermal potential: 16GW Natural Gas reserves: 329 tcf
Currently, about 1-2 GW of new installed capacity deployed a
http://www.worldbank.org/africa/powerofthemine
3
http://www.worldbank.org/africa/powerofthemine
4
Investment in mining accounted for $3.1 billion between 2000 -2012…
1,000 2,000 3,000 4,000 5,000 6,000 2002 2004 2006 2008 2010 2012 Million
Latin America Africa Canada Australia United States Pacific region
…and will go up to $75 billion in SSA in pipeline projects
14 countries.
http://www.worldbank.org/africa/powerofthemine
5
Refining
Power requirements
Smelting Processing Crushing
5 10 15 20
Iron Ore/Steel (t) Zinc (t) Platinum Group Metals (oz) Copper (t) Cobalt (t) Nickel (t) Bauxite/Aluminum (t)
MWh Basic and intermediate Smelting Refining
http://www.worldbank.org/africa/powerofthemine
6
South Africa = 3.5% SSA, excluding South Africa = 9.2%
Note: CAGR=Compound Annual Growth Rate
5.6 10 13.1 2.5 5.2 10.3
Pre-2000 2012 2020
GW
South Africa SSA, excluding South Africa
CAGR=5.6% CAGR=5.5%
~ 15 GW ~ 23 GW ~ 8 GW
http://www.worldbank.org/africa/powerofthemine
Highest increase in power demand – Iron Ore and PGM Refining and Smelting
7
Mining and nonmining (residential, commercial, industrial) demand
48% 50% 52% 64% 74% 84% 97% 135% 294% 326% 0% 50% 100% 150% 200% 250% 300% 350% Cameroon Congo, Rep. of the Congo, Dem. Rep. of Zambia Namibia Niger Sierra Leone Mozambique Guinea Liberia Mining demand as % of total non-mining demand
Mining and residential demand
100 150 200 250
Residential Mining Residential Mining
GWh 2012 2020*
15 x 3 x
*If all SSA’s population had access to electricity by 2020 with triple level of today’s consumption
http://www.worldbank.org/africa/powerofthemine
8
2020
Self-supply Self-supply + Social Responsabi lity Self-supply + sell to the grid Grid supply + self supply backup Mines sell collectively to grid Mines invest in grid Mines serve as anchor demand for IPP Grid supply
Intermediate 1 3 2 0.9 1.3 5.8 2.4 5.7 15.3
4 8 12 16 Self-supply Intermediate arrangements Grid supply
GW
2000 Energy requirements
http://www.worldbank.org/africa/powerofthemine
9
Mines:
High cost of electricity Loss of competitiveness
Electricity utility:
Loss of large customers Loss of steady revenue Loss of opportunities of economies of scale for large investments
Country:
Reducing possibilities for access to electricity Drop in exports and tax revenues Negative impact on GDP, and fewer jobs
Grid-connected customers
No electricity
Mine generation investments in self- supply 2012 – $1.3b 2020 – up to $3.3b
No electricity http://www.worldbank.org/africa/powerofthemine
Source of power generation on grid-based arrangements 10
Including South Africa Excluding South Africa
2,000 4,000 6,000 8,000 10,000 12,000 14,000
Coal Gas Hydro Oil
MW 2012 2020
1,000 2,000 3,000 4,000 5,000 6,000
Coal Gas Hydro Oil
MW 2012 2020
http://www.worldbank.org/africa/powerofthemine
Siguiri, Kiniero, Lefa, Tri-K, and Kouroussa
– Mines self-supply (diesel) – Shared 150MW hydropower plant (HPP) among mines – Shared 300MW HPP plant also serves neighboring communities Siguiri and Kankan
total population.
costs and economies of scale: cost savings for mines around $640 million
24.5 4.9 5.0 10 20 30 Mines Self-supply Shared hydro plant - Mines supply Shared hydro plant - Mines and towns supply c/kWh
Levelized costs per kWh
11 http://www.worldbank.org/africa/powerofthemine
12
1,000 2,000 3,000 4,000 5,000 6,000 7,000 8,000 9,000 10,000 1983 1988 1993 1998 2003 2008 2013 US$
Mineral Prices 1983-2014
Aluminum, $/mt, nominal$ Copper, $/mt, nominal$ Gold, $/toz, nominal$ Lead, $/mt, nominal$ Nickel, 10$/mt, nominal$ Silver, cents/toz, nominal$ Tin, cents/kg, nominal$ Zinc, $/mt, nominal$ Platinum, $/troz Iron ore, cfr spot $/dry mt
http://www.worldbank.org/africa/powerofthemine
13
Strengthen power sector finances Strengthen regulatory mechanisms Transparent and efficient pricing Support the
environment for IPPs Mine-financed power projects and carefully crafted contracts Integrate mining demand in power sector planning Use regional platforms Source expertise
http://www.worldbank.org/africa/powerofthemine
14
http://www.worldbank.org/africa/powerofthemine
15
Sudeshna Ghosh Banerjee Senior Economist sgbanerjee@worldbank.org http://www.worldbank.org/africa/powerofthemine
http://www.worldbank.org/africa/powerofthemine
http://www.worldbank.org/africa/powerofthemine
Follow the conversation on Twitter with @WBlive and #Power4Africa