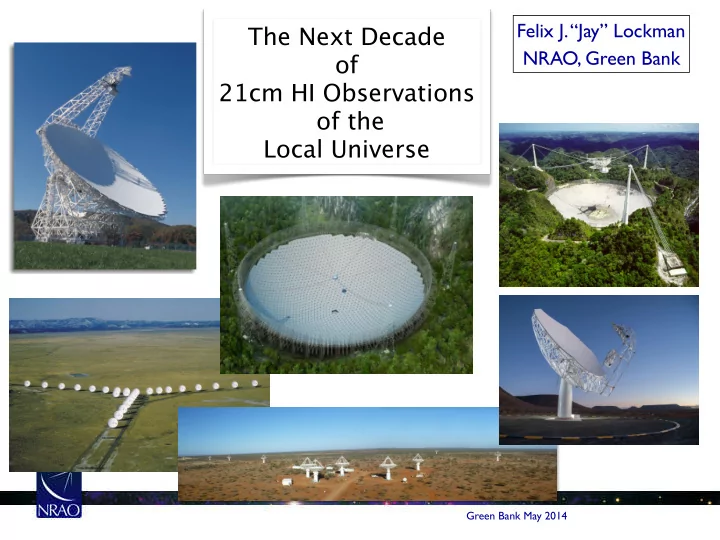
SLIDE 1 Felix J. “Jay” Lockman NRAO, Green Bank
Green Bank May 2014
The Next Decade
21cm HI Observations
Local Universe
SLIDE 2 t ∝ f 2 ∝ Diam4 A2
e
2
✴ for an unresolved (point) source, signal
strength is proportional to collecting area
✴ for a resolved source it depends on the
configuration of the collecting area
✴ time to detect goes as signal-2
point source resolved source
Green Bank May 2014
A digression on the sensitivity of a radio telescope
SLIDE 3 t ∝ f 2 ∝ Diam4 A2
e
t ∝ 1 A2
e
2
✴ for an unresolved (point) source, signal
strength is proportional to collecting area
✴ for a resolved source it depends on the
configuration of the collecting area
✴ time to detect goes as signal-2
point source resolved source
Green Bank May 2014
A digression on the sensitivity of a radio telescope
SLIDE 4 f ≡ Diam2 4r2
a Na
3 Green Bank May 2014
Surface brightness efficiency
Instrument f 21cm HPBW GBT 1 9.1’ Arecibo 1 3.2’ VLA-D ∼102 46” VLA-C ∼103 14” VLA-B ∼104 4.3” ASKAP ∼103
GBT VLA-D Diam Diam
t ∝ f 2 ∝ Diam4 A2
e
A digression on sensitivity
SLIDE 5 f ≡ Diam2 4r2
a Na
3 Green Bank May 2014
Surface brightness efficiency
Instrument f 21cm HPBW GBT 1 9.1’ Arecibo 1 3.2’ VLA-D ∼102 46” VLA-C ∼103 14” VLA-B ∼104 4.3” ASKAP ∼103
GBT VLA-D Diam Diam
t ∝ f 2 ∝ Diam4 A2
e
A digression on sensitivity
For a given collecting area, the brightness sensitivity is always greatest for a filled aperture
SLIDE 6 4
Aperture Synthesis: * High angular resolution on bright emission * High dynamic range * Low confusion * ... Filled Aperture * Extended source “short spacing” data * Highest-performance receiving systems * Low surface brightness phenomena * ...
Green Bank May 2014
End of digression...
SLIDE 7 4
Aperture Synthesis: * High angular resolution on bright emission * High dynamic range * Low confusion * ... Filled Aperture * Extended source “short spacing” data * Highest-performance receiving systems * Low surface brightness phenomena * ...
Green Bank May 2014
End of digression...
SLIDE 8 HI disks of galaxies
NHI = 1021.5 cm-2 Tb = 65 K t ≈ 2x10⁻⁵ f2 sec
Instrument f2 21 cm HPBW GBT 1 9.1’ Arecibo 1 3.2’ VLA-D ∼104 46” VLA-C ∼106 14” VLA-B ∼108 4.3”
HI edges of galaxies
NHI = 1019.5 Tb = 0.6 K t ≈ 0.2 f2 sec
THINGS VLA Survey Walter et al. 2008 at 30” resolution 3σ=1019.5 at 6” resolution 3σ=1020.5
Neutral Hydrogen (HI) in galaxies
t ≡3σ detection time for 21cm line
Green Bank May 2014
SLIDE 9 Green Bank May 2014
What drives galaxy growth and evolution?
Theory: Interactions, Fountains and winds, Inflow Measurement: Interaction, Fountains & winds, Inflow?
We can learn the most looking outside a galaxy’s disk
SLIDE 10 7 Green Bank May 2014
The M81 group
Optical + VLA + GBT Chynoweth et al 2009
Galaxies in groups interact Interactions
SLIDE 11 7 Green Bank May 2014
The M81 group
Optical + VLA + GBT Chynoweth et al 2009
Group HI
NHI = 1018.5 Tb = 0.06 K t ≈ 20 f2 sec
Galaxies in groups interact Interactions
SLIDE 12 Green Bank May 2014
Interactions The Magellanic Stream
SLIDE 13 9
The tip of the Magellanic Stream
NHI = 1017.5 Tb=6 mK t ≈ 1600 f2 s
Nidever et al 2010 Composite of Parkes, GBT, WSRT-SD
Instrument f2
GBT ∼1 EVLA-D ∼104 EVLA-C ∼106 EVLA-B ∼108
Interactions
Green Bank May 2014
SLIDE 14
Superbubbles are one mechanism for putting HI into the halo
Pidopryhora, Lockman & Shields 2007, ApJ, 656, 928
Fountains & winds
SLIDE 15
Superbubbles are one mechanism for putting HI into the halo
Pidopryhora, Lockman & Shields 2007, ApJ, 656, 928
NHI = 1018.5 Tb=60 mK t ≈ 16 f2 s
Fountains & winds
SLIDE 16 12
The “Smith” High Velocity Cloud Hydrogen image of the inner Milky Way
(from old survey data)
Green Bank May 2014
SLIDE 17 12
The “Smith” High Velocity Cloud Hydrogen image of the inner Milky Way
(from old survey data)
GBT
Green Bank May 2014
SLIDE 18 Green Bank May 2014
The Smith Cloud is bound to the Galaxy
Milky Way Vesc ~ 500 km/s Smith Vtot ≲ 300 km/s Smith Vθ ≈ 260 km/s
Lockman et al (2008, 2014)
... and will hit the Galactic plane adding angular momentum to the disk
VLSR = R0sin(`){Vθ R − V0 R0 } − VR cos(` + ✓)
✔ ✔ ✔
Infall?
SLIDE 19 Green Bank May 2014
Nichols, Mirabal, Agertz, Lockman, Bland-Hawthorn (2014)
Does the Smith Cloud have dark matter?
SLIDE 20 15
“On the continuing formation of the Andromeda Galaxy: Detection of HI Clouds in the M31 Halo”
Thilker et al 2004 ApJ
Text
Instrument f2 GBT 1 VLA-D ∼104 VLA-C ∼106 VLA-B ∼108
GBT Detection of High-velocity HI Clouds Around Andromeda 106-7 M⊙
Green Bank May 2014
What is the origin
SLIDE 21 15
“On the continuing formation of the Andromeda Galaxy: Detection of HI Clouds in the M31 Halo”
Thilker et al 2004 ApJ
Text
Extraplanar HI
NHI = 1018.5 Tb = 0.06 K t ≈ 20 f2 sec
Instrument f2 GBT 1 VLA-D ∼104 VLA-C ∼106 VLA-B ∼108
GBT Detection of High-velocity HI Clouds Around Andromeda 106-7 M⊙
Green Bank May 2014
What is the origin
SLIDE 22
High Velocity Clouds around galaxies
M31 -- GBT
Thilker et al. 2004, ApJ, 601, L39 contours at 0.5,1,2,10,20 x 1018 HI Masses = 106-7 M⊙
M33 -- Arecibo
Grossi et al. 2008, A&A, 487, 161 lowest contour 2x10¹⁸
The Milky Way has HVCs covering 40% - 80% of the sky
SLIDE 23 Gas distribution in local group galaxies 11
Figure 10. Contours of the H i gas distribution around the simulated M31c (left-hand panel) and MWc (right-hand panel) for two arbitrary edge-on views. The contours indicate column densities of NHI ≥ 1015 cm−2 (dotted lines); NHI ≥ 1016 cm−2 (short-dashed lines); NHI ≥ 1017 cm−2 (long-dashed lines); NHI ≥ 1018 cm−2 (dotted-dashed lines); NHI ≥ 1019 cm−2 (three-dotted-dashed lines), and NHI ≥ 1020 cm−2 (solid lines).
NHI = 1017
Infall?
The distribution of gas in the Local Group from constrained cosmological simulations: the case for Andromeda and the Milky Way galaxies
Nuza et al. 2014 arXiv:1403.7528
Green Bank May 2014
SLIDE 24 2 Nuza et al.
Figure 1. Gas density maps of the simulated LG at z = 0 for the hot (T ≥ 105 K; left-hand panel), cold (T < 105 K; middle panel) and H i (right-hand panel) components. The plots are centred in the MWc/M31c system. The virial radii of our Milky Way and Andromeda candidates are shown as dashed and solid lines respectively. In order to highlight the differences in the distribution of the hot, cold and neutral gas components, each plot shows the projected density in a color scale covering four orders of magnitude.
The distribution of gas in the Local Group from constrained cosmological simulations: the case for Andromeda and the Milky Way galaxies
Nuza et al. 2014 arXiv:1403.7528
Infall?
Green Bank May 2014
SLIDE 25 19
HI in the Local Group of Galaxies
1 Mpc
Green Bank May 2014
Galaxy Formation is a Continuing Process M33 M31
SLIDE 26 Green Bank May 2014
M31 Interactions
(Lewis et al 2013)
GBT survey
SLIDE 27 Green Bank May 2014
M31 Interactions
(Lewis et al 2013)
GBT 21cm HI NHI = 1017.5 Tb = 0.006 K t ≈ 2 000 f2 s GBT survey
SLIDE 28 21 Green Bank May 2014
Discrete HI Clouds between M31 and M33
Wolfe et al. (2013)
SLIDE 29 21
9’ resolution
Green Bank May 2014
Discrete HI Clouds between M31 and M33
Wolfe et al. (2013)
SLIDE 30 21
9’ resolution
Green Bank May 2014
Smith Cloud
Discrete HI Clouds between M31 and M33
Wolfe et al. (2013)
SLIDE 31 22
NATURE May 9, 2013
Green Bank May 2014
SLIDE 32 22
NATURE May 9, 2013
Green Bank May 2014
log(MHI): 4.6-5.6 M⊙ size: <3 - 6.4 kpc
SLIDE 33 23 Green Bank May 2014
The Next Decade of 21cm HI Observations
Local Universe
Theory: Interactions, Fountains and winds, Inflow Measurement: * Diffuse gas in the Local Group * Diffuse HI around other spirals * Studies of HVCs in the MW and other galaxies * The wind from the Galactic Center Measurements at NHI = 1017 cm-2 will be key
SLIDE 34 24 Green Bank May 2014
SLIDE 35 A Wind from the Center of the Milky Way
A wind in the Galaxy -- Bregman, 1980 The HI Halo in the Inner Galaxy -- Lockman 1984 The Large-Scale Bipolar Wind in the Galactic Center -- Bland-Hawthorn & Cohen 2003 Does the Milky Way Produce a Nuclear Galactic Wind? -- Keeney et al 2006 Giant Gamma-ray Bubbles from Fermi-LAT: Active Galactic Nucleus Activity or Bipolar Galactic Wind? -- Su et al 2010 Non-thermal insights on mass and energy flows through the Galactic Centre and into the Fermi bubbles -- Crocker 2012 Giant magnetized outflows from the centre of the Milky Way -- Carretti et al. 2013 The Fermi bubbles as starburst wind termination shocks -- Lacki, 2013 The Fermi Bubbles: Possible Nearby Laboratory for AGN Jet Activity -- Yang et al. 2013 Atomic Hydrogen in a Galactic Center Outflow -- McClure-Griffiths et al 2013
Green Bank May 2014
SLIDE 36 A Wind from the Center of the Milky Way
A wind in the Galaxy -- Bregman, 1980 The HI Halo in the Inner Galaxy -- Lockman 1984 The Large-Scale Bipolar Wind in the Galactic Center -- Bland-Hawthorn & Cohen 2003 Does the Milky Way Produce a Nuclear Galactic Wind? -- Keeney et al 2006 Giant Gamma-ray Bubbles from Fermi-LAT: Active Galactic Nucleus Activity or Bipolar Galactic Wind? -- Su et al 2010 Non-thermal insights on mass and energy flows through the Galactic Centre and into the Fermi bubbles -- Crocker 2012 Giant magnetized outflows from the centre of the Milky Way -- Carretti et al. 2013 The Fermi bubbles as starburst wind termination shocks -- Lacki, 2013 The Fermi Bubbles: Possible Nearby Laboratory for AGN Jet Activity -- Yang et al. 2013 Atomic Hydrogen in a Galactic Center Outflow -- McClure-Griffiths et al 2013
Green Bank May 2014
SLIDE 37 1.7 2.6 3.4 4.2 5.1 6.0 6.8 7.6 0.0 0.26 0.43 0.60 R (kpc) z - z0 (kpc)
Why is there no extended HI halo in the inner Milky Way?
Fraction of HI found below a given height from Lockman (1984)
Green Bank May 2014
SLIDE 38 Why is there no extended HI halo in the inner Milky Way?
Data from a new GBT survey (in prep)
Green Bank May 2014
SLIDE 39 Atomic Hydrogen in a Galactic Center Outflow
McClure-Griffiths, Green, Hill, Lockman, Dickey, Gaensler & Green, 2013 ApJ 770, L4
Australia Telescope Compact Array
A population of small HI clouds toward the Galactic Center
confused region
Green Bank May 2014
SLIDE 40 Property Med Min Max r ¡(pc) 15.0 3.5 32.9 Mc ¡(Msun) 270 5 2100 Δv ¡(km ¡s-‑1) 13.6 3.0 30.9 Tk ¡(K) 4000 200 105 NH ¡(1019 ¡cm-‑2) 9.9 1.0 35 Total ¡HI ¡Mass 4x10⁴ HI ¡Ek ¡(ergs) 2x1052
Cloud radial velocity ~200 km/s
cloud lifetime ≳3 Myr
Text
Green Bank May 2014
SLIDE 41 The M31-M33 HI clouds are not part of the high velocity cloud systems of M31 or M33
30 Green Bank May 2014
M33 HVC M31 HVC
Wolfe et al. (2013)
SLIDE 42 31
z>0 (above the plane) z<0 (below the plane) current location Sun 5 Myr intervals crosses the plane in 30 Myr
The Smith Cloud Trajectory?? Where did the Cloud arise?
Green Bank May 2014
SLIDE 43 32
The Milky Way?
SLIDE 44 The “Smith” Milky Way High Velocity Cloud
2 kpc
dist = 12.4 ± 1.3 kpc R = 7.6 ± 1.0 kpc z = -2.2 kpc MHI > 2x10⁶ M⊙ size ≈ 3 x 1 kpc No Stars!
Wakker et al (2008) Lockman et al (2008, 2014)
HI from new GBT survey
Green Bank May 2014
Infall?
SLIDE 45 Discrete HI Clouds between M31 and M33
Smith: MHI > 106 M⊙ Diameter 1x3 kpc
No stars in any of these! Not self-gravitating
Green Bank May 2014
Wolfe et al. (2013, Nature)
SLIDE 46 The Smith Cloud has ionized gas
2 kpc
dist = 12.4 ± 1.3 kpc R = 7.6 ± 1.0 kpc z = -2.2 kpc MHI > 2x10⁶ M⊙ size ≈ 3 x 1 kpc No Stars! H+ data from WHAM (Wisconsin H-alpha mapper) MH+ > 106 M⊙ [N\H] = 0.14 - 0.44
Lockman et al (2008, 2014) Hill et al (2009)
At M31 <Tb>≈0.084 K
Green Bank May 2014
Infall?
SLIDE 47 The Smith Cloud has ionized gas
2 kpc
dist = 12.4 ± 1.3 kpc R = 7.6 ± 1.0 kpc z = -2.2 kpc MHI > 2x10⁶ M⊙ size ≈ 3 x 1 kpc No Stars! H+ data from WHAM (Wisconsin H-alpha mapper) MH+ > 106 M⊙ [N\H] = 0.14 - 0.44
Lockman et al (2008, 2014) Hill et al (2009)
At M31 <Tb>≈0.084 K
Green Bank May 2014
GBT HI
Infall?
SLIDE 48 Green Bank May 2014
This is why the VLBA can’t detect anything below ~105 K