
SLIDE 1
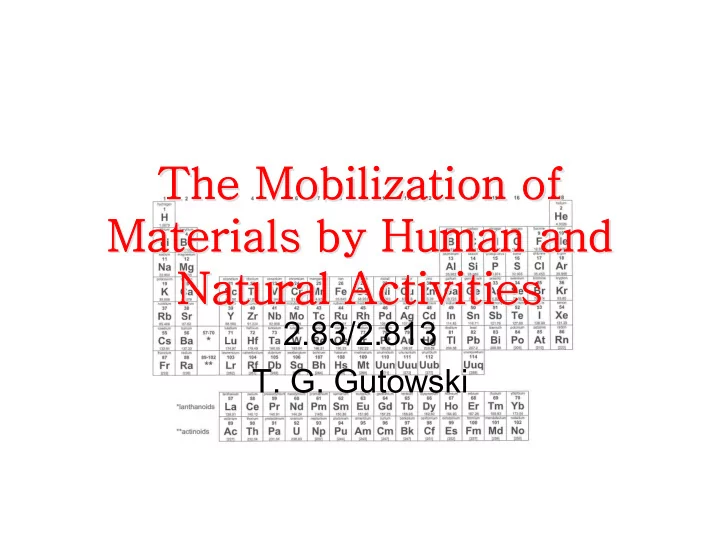
The Mobilization of The Mobilization of Materials by Human and Materials by Human and Natural Activities Natural Activities
2.83/2.813
- T. G. Gutowski
The Mobilization of The Mobilization of Materials by Human and - - PowerPoint PPT Presentation
The Mobilization of The Mobilization of Materials by Human and Materials by Human and Natural Activities Natural Activities 2.83/2.813 T. G. Gutowski Materials Focus 1. Global Cycles; Stocks and Flows carbon, rock, water, nitrogen,
2.83/2.813
2
3
in
(stock)
in
stock) to (addition
4
in
(stock)
“Residence Time”
5
~10 years
hours to weeks
48 million years
100 years
Press and Siever
6
Stock or Reservoir A Stock or Reservoir B Stock or Reservoir C
7
8
http://www.env.leeds.ac.uk/envi2150/oldnotes/lecture3/lecture3.html
9
Stock or Reservoir A Stock or Reservoir B Stock or Reservoir C
Number of two way "conversations" = n(n-1) 2
10
11
Smil 2001
12
Stocks Stores in Atmosphere: ≈ 4 Et N Stores in Soil: ≈ 95 Gt N Flows Haber-Bosch Flow: ≈ 100 Mt N/yr Natural Nitrogen Fixing Flow is
anthropogenic flow Flow to Plants (NPP), Klee & Graedel estimate 5.6 Gt N
13
Hypoxia can cause fish to leave the area and can cause stress or death to bottom dwelling
by excess nutrients delivered from the Mississippi River in combination with seasonal stratification of Gulf waters. Excess nutrients promote algal and attendant zooplankton
to the bottom where it decomposes, consuming available oxygen. Ref USGS, WRI
14
ecosphere Techno
in
stock) to (addition
ecosphere:
15
ecosphere Techno
Carbon used in 2005 was 7.5 Gt According to Smil it takes Approximately 7000 times the Phytomass to produce
Therefore we need 7.5 X 7000 GtC each year Estimates of planetary NPP are about 105GtC We need approximately 500 times todays NPP to satisfy
See Smil, Vaclav, Energy in Nature And Society MIT Press 2008 p 73
16
Consider An alternate View: The Biosphere For our purposes, approximately closed to materials, but with heat and work interactions.
Now ΔM = 0
17
degradation of quality and renewables
18
– weathering and erosion – sea spray – primary plant productivity
– mining – fossil fuels – biomass burning
19
plant uptake
aerosols
crustal weathering
to air
to air
from reservoir
20
Results for Magnesium Klee & Graedel 2004
21
1A VIIIA
1
H
IIA IIIA IVA VA VIA VIIA
2
He
3
Li
4
Be
5
B
6
C
7
N
8
O
9
F
10
Ne
11
Na
12
Mg
IIB IVB VB VIB VIIB VIIIB IB IIB
13
Al
14
Si
15
P
16
S
17
Cl
18
Ar
19
K
20
Ca
21
Sc
22
Ti
23
V
24
Cr
25
Mn
26
Fe
27
Co
28
Ni
29
Cu
30
Zn
31
Ga
32
Ge
33
As
34
Se
35
Br
36
Kr
37
Rb
38
Sr
39
Y
40
Zr
41
Nb
42
Mo
43
Tc
44
Ru
45
Rh
46
Pd
47
Ag
48
Cd
49
ln
50
Sn
51
Sb
52
Te
53
I
54
Xe
55
Cs
56
Ba
57
La
72
Hf
73
Ta
74
W
75
Re
76
Os
77
Ir
78
Pt
79
Au
80
Hg
81
Ti
82
Pb
83
Bi
84
Po
85
At
86
Rn
87
Fr
88
Ra
89
Ac
58
Ce
59
Pr
60
Nd
61
Pm
62
Sm
63
Eu
64
Gd
65
Tb
66
Dy
67
Ho
68
Er
69
Tm
70
Yb
71
Lu
90
Th
91
Pa
92
U
Dominat ed (>50% of Mobilizat ion) Pert urbed (15-50% of Mobilizat ion) Unpert urbed (<15% of Mobilizat ion) Undet ermined
22
23
major flux category
flux category
24
Quantities Mobilized from Klee and Graedel
= 1.5 Gt/yr 1,500 Tg/yr Erosion to rivers = 224.5 Gt/yr 224,500 Tg/yr NPP = 3.8 Gt/yr 3,800 Tg/yr Sea spray = 8.6 Gt/yr 8,600 Tg/yr Biomass burning = 3.3 Gt/yr 3,268 Tg/yr Oil = 4.7 Gt/yr 4,741 Tg/yr Coal Mass/yr Mass/yr Category
25
2 He
0.00001
20
0.2
2.0 0.0004d 3.1
50 0.2e 17 4.5 58 6 C 890000a 855000f 3240 28 478000i 7 N 5850a 10500f 83 150 25000 9 F 150
1.3
400b 12 25670 10770 1100 12 Mg 700b 0.1d 13510 1290 6250 13 Al 11000b 0.5d 77440 0.002 500j 14 Si
2.2
150
0.1 2250 16 S 13500a 10300f 953 905 2000 17 Cl 1000 10 640 19354 550 19 K 1000b 4.9 28650 399 32500 20 Ca 2300b 5.0d 29450 412 30000 21 Sc 4.0 0.004 7.0
600 0.1 3117
23 V 40 279 53 0.003 1.6j
26
Aluminum Production
5,000,000 10,000,000 15,000,000 20,000,000 25,000,000 30,000,000 1850 1900 1950 2000 2050 year metric tons Primary production Secondary production Apparent consumption World production
27
air in 1883, almost total darkness in Jakarta, lowers earth’s temperature a few degrees for several years
28
Mt Krakatoa*
1A VIIIA
1
H
IIA IIIA IVA VA VIA VIIA
2
He
3
Li
4
Be
5
B
6
C
7
N
8
O
9
F
10
Ne
11
Na
12
Mg
IIB IVB VB VIB VIIB VIIIB IB IIB
13
Al
14
Si
15
P
16
S
17
Cl
18
Ar
19
K
20
Ca
21
Sc
22
Ti
23
V
24
Cr
25
Mn
26
Fe
27
Co
28
Ni
29
Cu
30
Zn
31
Ga
32
Ge
33
As
34
Se
35
Br
36
Kr
37
Rb
38
Sr
39
Y
40
Zr
41
Nb
42
Mo
43
Tc
44
Ru
45
Rh
46
Pd
47
Ag
48
Cd
49
ln
50
Sn
51
Sb
52
Te
53
I
54
Xe
55
Cs
56
Ba
57
La
72
Hf
73
Ta
74
W
75
Re
76
Os
77
Ir
78
Pt
79
Au
80
Hg
81
Ti
82
Pb
83
Bi
84
Po
85
At
86
Rn
87
Fr
88
Ra
89
Ac
58
Ce
59
Pr
60
Nd
61
Pm
62
Sm
63
Eu
64
Gd
65
Tb
66
Dy
67
Ho
68
Er
69
Tm
70
Yb
71
Lu
90
Th
91
Pa
92
U
Dominat ed (>50% of Mobilizat ion) Pert urbed (15-50% of Mobilizat ion) Unpert urbed (<15% of Mobilizat ion) Undet ermined
29
– lead – mercury – cadmium – arsenic
30
Periodic Table Showing Toxicity*
1A VIIIA
1
H
IIA IIIA IVA VA VIA VIIA
2
He
3
Li
4
Be
5
B
6
C
7
N
8
O
9
F
10
Ne
11
Na
12
Mg
IIB IVB VB VIB VIIB VIIIB IB IIB
13
Al
14
Si
15
P
16
S
17
Cl
18
Ar
19
K
20
Ca
21
Sc
22
Ti
23
V
24
Cr
25
Mn
26
Fe
27
Co
28
Ni
29
Cu
30
Zn
31
Ga
32
Ge
33
As
34
Se
35
Br
36
Kr
37
Rb
38
Sr
39
Y
40
Zr
41
Nb
42
Mo
43
Tc
44
Ru
45
Rh
46
Pd
47
Ag
48
Cd
49
ln
50
Sn
51
Sb
52
Te
53
I
54
Xe
55
Cs
56
Ba
57
La
72
Hf
73
Ta
74
W
75
Re
76
Os
77
Ir
78
Pt
79
Au
80
Hg
81
Ti
82
Pb
83
Bi
84
Po
85
At
86
Rn
87
Fr
88
Ra
89
Ac
58
Ce
59
Pr
60
Nd
61
Pm
62
Sm
63
Eu
64
Gd
65
Tb
66
Dy
67
Ho
68
Er
69
Tm
70
Yb
71
Lu
90
Th
91
Pa
92
U
High Toxicit y Moderat e Toxicit y *Adapt ed from Indust rial Ecology (Table 10.5)
31
1A VIIIA
1
H
IIA IIIA IVA VA VIA VIIA
2
He
3
Li
4
Be
5
B
6
C
7
N
8
O
9
F
10
Ne
11
Na
12
Mg
IIB IVB VB VIB VIIB VIIIB IB IIB
13
Al
14
Si
15
P
16
S
17
Cl
18
Ar
19
K
20
Ca
21
Sc
22
Ti
23
V
24
Cr
25
Mn
26
Fe
27
Co
28
Ni
29
Cu
30
Zn
31
Ga
32
Ge
33
As
34
Se
35
Br
36
Kr
37
Rb
38
Sr
39
Y
40
Zr
41
Nb
42
Mo
43
Tc
44
Ru
45
Rh
46
Pd
47
Ag
48
Cd
49
ln
50
Sn
51
Sb
52
Te
53
I
54
Xe
55
Cs
56
Ba
57
La
72
Hf
73
Ta
74
W
75
Re
76
Os
77
Ir
78
Pt
79
Au
80
Hg
81
Ti
82
Pb
83
Bi
84
Po
85
At
86
Rn
87
Fr
88
Ra
89
Ac
58
Ce
59
Pr
60
Nd
61
Pm
62
Sm
63
Eu
64
Gd
65
Tb
66
Dy
67
Ho
68
Er
69
Tm
70
Yb
71
Lu
90
Th
91
Pa
92
U
54 12 13 Unpert urbed (<15% of Mobilizat ion) Undet ermined High Toxicit y Moderat e Toxicit y Dominat ed (>50% of Mobilizat ion) Pert urbed (15-50% of Mobilizat ion)
32
Only toxics colored, 90% are red and 100% are red or green!
1A VIIIA
1
H
IIA IIIA IVA VA VIA VIIA
2
He
3
Li
4
Be
5
B
6
C
7
N
8
O
9
F
10
Ne
11
Na
12
Mg
IIB IVB VB VIB VIIB VIIIB IB IIB
13
Al
14
Si
15
P
16
S
17
Cl
18
Ar
19
K
20
Ca
21
Sc
22
Ti
23
V
24
Cr
25
Mn
26
Fe
27
Co
28
Ni
29
Cu
30
Zn
31
Ga
32
Ge
33
As
34
Se
35
Br
36
Kr
37
Rb
38
Sr
39
Y
40
Zr
41
Nb
42
Mo
43
Tc
44
Ru
45
Rh
46
Pd
47
Ag
48
Cd
49
ln
50
Sn
51
Sb
52
Te
53
I
54
Xe
55
Cs
56
Ba
57
La
72
Hf
73
Ta
74
W
75
Re
76
Os
77
Ir
78
Pt
79
Au
80
Hg
81
Ti
82
Pb
83
Bi
84
Po
85
At
86
Rn
87
Fr
88
Ra
89
Ac
58
Ce
59
Pr
60
Nd
61
Pm
62
Sm
63
Eu
64
Gd
65
Tb
66
Dy
67
Ho
68
Er
69
Tm
70
Yb
71
Lu
90
Th
91
Pa
92
U
54 12 13 Unpert urbed (<15% of Mobilizat ion) Undet ermined High Toxicit y Moderat e Toxicit y Dominat ed (>50% of Mobilizat ion) Pert urbed (15-50% of Mobilizat ion)
33
50% bio-mass burning
34
50% fossil fuels, 10% mining, 50% bio-mass burning
1A VIIIA
1
H
IIA IIIA IVA VA VIA VIIA
2
He
3
Li
4
Be
5
B
6
C
7
N
8
O
9
F
10
Ne
11
Na
12
Mg
IIB IVB VB VIB VIIB VIIIB IB IIB
13
Al
14
Si
15
P
16
S
17
Cl
18
Ar
19
K
20
Ca
21
Sc
22
Ti
23
V
24
Cr
25
Mn
26
Fe
27
Co
28
Ni
29
Cu
30
Zn
31
Ga
32
Ge
33
As
34
Se
35
Br
36
Kr
37
Rb
38
Sr
39
Y
40
Zr
41
Nb
42
Mo
43
Tc
44
Ru
45
Rh
46
Pd
47
Ag
48
Cd
49
ln
50
Sn
51
Sb
52
Te
53
I
54
Xe
55
Cs
56
Ba
57
La
72
Hf
73
Ta
74
W
75
Re
76
Os
77
Ir
78
Pt
79
Au
80
Hg
81
Ti
82
Pb
83
Bi
84
Po
85
At
86
Rn
87
Fr
88
Ra
89
Ac
58
Ce
59
Pr
60
Nd
61
Pm
62
Sm
63
Eu
64
Gd
65
Tb
66
Dy
67
Ho
68
Er
69
Tm
70
Yb
71
Lu
90
Th
91
Pa
92
U
Dominat ed (>50% of Mobilizat ion) Pert urbed (15-50% of Mobilizat ion) Unpert urbed (<15% of Mobilizat ion) Undet ermined
35
Mining=0
1A VIIIA
1
H
IIA IIIA IVA VA VIA VIIA
2
He
3
Li
4
Be
5
B
6
C
7
N
8
O
9
F
10
Ne
11
Na
12
Mg
IIB IVB VB VIB VIIB VIIIB IB IIB
13
Al
14
Si
15
P
16
S
17
Cl
18
Ar
19
K
20
Ca
21
Sc
22
Ti
23
V
24
Cr
25
Mn
26
Fe
27
Co
28
Ni
29
Cu
30
Zn
31
Ga
32
Ge
33
As
34
Se
35
Br
36
Kr
37
Rb
38
Sr
39
Y
40
Zr
41
Nb
42
Mo
43
Tc
44
Ru
45
Rh
46
Pd
47
Ag
48
Cd
49
ln
50
Sn
51
Sb
52
Te
53
I
54
Xe
55
Cs
56
Ba
57
La
72
Hf
73
Ta
74
W
75
Re
76
Os
77
Ir
78
Pt
79
Au
80
Hg
81
Ti
82
Pb
83
Bi
84
Po
85
At
86
Rn
87
Fr
88
Ra
89
Ac
58
Ce
59
Pr
60
Nd
61
Pm
62
Sm
63
Eu
64
Gd
65
Tb
66
Dy
67
Ho
68
Er
69
Tm
70
Yb
71
Lu
90
Th
91
Pa
92
U
Dominat ed (>50% of Mobilizat ion) Pert urbed (15-50% of Mobilizat ion) Unpert urbed (<15% of Mobilizat ion) Undet ermined
36
Fossil Fuel consumption=0
1A VIIIA
1
H
IIA IIIA IVA VA VIA VIIA
2
He
3
Li
4
Be
5
B
6
C
7
N
8
O
9
F
10
Ne
11
Na
12
Mg
IIB IVB VB VIB VIIB VIIIB IB IIB
13
Al
14
Si
15
P
16
S
17
Cl
18
Ar
19
K
20
Ca
21
Sc
22
Ti
23
V
24
Cr
25
Mn
26
Fe
27
Co
28
Ni
29
Cu
30
Zn
31
Ga
32
Ge
33
As
34
Se
35
Br
36
Kr
37
Rb
38
Sr
39
Y
40
Zr
41
Nb
42
Mo
43
Tc
44
Ru
45
Rh
46
Pd
47
Ag
48
Cd
49
ln
50
Sn
51
Sb
52
Te
53
I
54
Xe
55
Cs
56
Ba
57
La
72
Hf
73
Ta
74
W
75
Re
76
Os
77
Ir
78
Pt
79
Au
80
Hg
81
Ti
82
Pb
83
Bi
84
Po
85
At
86
Rn
87
Fr
88
Ra
89
Ac
58
Ce
59
Pr
60
Nd
61
Pm
62
Sm
63
Eu
64
Gd
65
Tb
66
Dy
67
Ho
68
Er
69
Tm
70
Yb
71
Lu
90
Th
91
Pa
92
U
Dominat ed (>50% of Mobilizat ion) Pert urbed (15-50% of Mobilizat ion) Unpert urbed (<15% of Mobilizat ion) Undet ermined
37
Fossil Fuels=0 and Mining=0
1A VIIIA
1
H
IIA IIIA IVA VA VIA VIIA
2
He
3
Li
4
Be
5
B
6
C
7
N
8
O
9
F
10
Ne
11
Na
12
Mg
IIB IVB VB VIB VIIB VIIIB IB IIB
13
Al
14
Si
15
P
16
S
17
Cl
18
Ar
19
K
20
Ca
21
Sc
22
Ti
23
V
24
Cr
25
Mn
26
Fe
27
Co
28
Ni
29
Cu
30
Zn
31
Ga
32
Ge
33
As
34
Se
35
Br
36
Kr
37
Rb
38
Sr
39
Y
40
Zr
41
Nb
42
Mo
43
Tc
44
Ru
45
Rh
46
Pd
47
Ag
48
Cd
49
ln
50
Sn
51
Sb
52
Te
53
I
54
Xe
55
Cs
56
Ba
57
La
72
Hf
73
Ta
74
W
75
Re
76
Os
77
Ir
78
Pt
79
Au
80
Hg
81
Ti
82
Pb
83
Bi
84
Po
85
At
86
Rn
87
Fr
88
Ra
89
Ac
58
Ce
59
Pr
60
Nd
61
Pm
62
Sm
63
Eu
64
Gd
65
Tb
66
Dy
67
Ho
68
Er
69
Tm
70
Yb
71
Lu
90
Th
91
Pa
92
U
Dominat ed (>50% of Mobilizat ion) Pert urbed (15-50% of Mobilizat ion) Unpert urbed (<15% of Mobilizat ion) Undet ermined
38
10 20 30 40 50 60 70 80 90 Klee & Graedel Realistic conversation Mining=0 Fossil Fuels=0 Fossil Fuels, Mining=0 Dominated Perturbed Unperturbed
Tot al
High Toxicit y Mod Toxicit y
Tot al
High Toxicit y Mod Toxicit y
Tot al
High Toxicit y Mod Toxicit y
Klee & Graedel 54 7 27 12 1 3 13 1 Realist ic conservat ion 27 3 11 27 3 15 25 3 4 Mining=0 31 3 16 24 4 10 24 2 4 Fossil Fuels=0 25 1 8 21 4 9 33 4 12 Fossil Fuels, Mining=0 79 9 30 Dominat ed Pert urbed Unpert urbed
Number of elements
39
40
Percent Anthropogenic Mobilization
1 0 2 0 3 0 4 0 5 0 6 0 7 01940
1 9 5 0 1 9 6 0 1 9 7 0 1 9 8 0 1 9 9 0 2 0 0 0 2 0 1 0Year !"#$"%& Zn As Se Br Mo Ag Cd Sn Sb Te
41
Natural Mobilization Dominance
1
H
IIA IIIA IVA VA VIA VIIA
2
He
3
Li
4
Be
5
B
6
C
7
N
8
O
9
F
10
Ne
11
Na
12
Mg
IIB IVB VB VIB VIIB VIIIB IB IIB
13
Al
14
Si
15
P
16
S
17
Cl
18
Ar
19
K
20
Ca
21
Sc
22
Ti
23
V
24
Cr
25
Mn
26
Fe
27
Co
28
Ni
29
Cu
30
Zn
31
Ga
32
Ge
33
As
34
Se
35
Br
36
Kr
37
Rb
38
Sr
39
Y
40
Zr
41
Nb
42
Mo
43
Tc
44
Ru
45
Rh
46
Pd
47
Ag
48
Cd
49
ln
50
Sn
51
Sb
52
Te
53
I
54
Xe
55
Cs
56
Ba
57
La
72
Hf
73
Ta
74
W
75
Re
76
Os
77
Ir
78
Pt
79
Au
80
Hg
81
Ti
82
Pb
83
Bi
84
Po
85
At
86
Rn
87
Fr
88
Ra
89
Ac
58
Ce
59
Pr
60
Nd
61
Pm
62
Sm
63
Eu
64
Gd
65
Tb
66
Dy
67
Ho
68
Er
69
Tm
70
Yb
71
Lu
90
Th
91
Pa
92
U
Crust al weat hering Seaspray Plant primary product ion Undet ermined
42
Natural Mobilization Dominance
1A VIIIA
1
H
IIA IIIA IVA VA VIA VIIA
2
He
3
Li
4
Be
5
B
6
C
7
N
8
O
9
F
10
Ne
11
Na
12
Mg
IIB IVB VB VIB VIIB VIIIB IB IIB
13
Al
14
Si
15
P
16
S
17
Cl
18
Ar
19
K
20
Ca
21
Sc
22
Ti
23
V
24
Cr
25
Mn
26
Fe
27
Co
28
Ni
29
Cu
30
Zn
31
Ga
32
Ge
33
As
34
Se
35
Br
36
Kr
37
Rb
38
Sr
39
Y
40
Zr
41
Nb
42
Mo
43
Tc
44
Ru
45
Rh
46
Pd
47
Ag
48
Cd
49
ln
50
Sn
51
Sb
52
Te
53
I
54
Xe
55
Cs
56
Ba
57
La
72
Hf
73
Ta
74
W
75
Re
76
Os
77
Ir
78
Pt
79
Au
80
Hg
81
Ti
82
Pb
83
Bi
84
Po
85
At
86
Rn
87
Fr
88
Ra
89
Ac
58
Ce
59
Pr
60
Nd
61
Pm
62
Sm
63
Eu
64
Gd
65
Tb
66
Dy
67
Ho
68
Er
69
Tm
70
Yb
71
Lu
90
Th
91
Pa
92
U
*crust al weat hering account s for more mobilizat ion of brown colored element s t han seaspray and plant primary product ion combined (similarly seaspray and plant primary product ion dominat e for blue and green colored element s respect fully). Crust al weat hering* Seaspray Plant primary product ion Ant hropogenic dominat es or undet ermined
43
504 TRIS(2,3-DIBROMOPROPYL) PHOSPHATE 58 505 TRYPAN BLUE 506 URETHANE 13092 13092 358 10864 507 VANADIUM (EXCEPT WHEN CONTAINED IN AN ALLOY) 14600 428388 414816 857804 1202 251336 508 VANADIUM COMPOUNDS 1070604 273368 17493434 18837406 21370 1107931 509 VINCLOZOLIN . . . 0 . . 510 VINYL ACETATE 451021 8445 459466 881264 2293042 511 VINYL CHLORIDE 139462 139462 190019 480973 512 VINYLIDENE CHLORIDE 101 101 42991 87763 513 WARFARIN AND SALTS 1 514 XYLENE (MIXED ISOMERS) 760707 71250 3055 835012 10207680 31740899 515 ZINC (FUME OR DUST) 32563907 321256 32885162 231814 679150 516 ZINC COMPOUNDS 524630 20377049 31395597 52297275 1890332 4524736 517 ZINEB 0 Total 201701899 123194823 272409300 597306022 208199640 1423962206
http://www.epa.gov/triexplorer/
45
46
47
(Modified to correct errors)
.005 4.6 4.5 .01 .08 Total
Tg/yr
Total
Gg/yr
NPP
Gg/yr
Sea
Gg/yr
Weather
Gg/yr
.03 28.2 .8 26 1.4 Total
Tg/yr
Total
Gg/yr
Burn
Gg/yr
Fossil
Gg/yr
Mining
Gg/yr
48
Anthropogenic Mercury US and World
5,000 10,000 15,000 20,000 1850 1900 1950 2000 2050 Year Amount (Metric Tons) Primary production Apparent consumption Unit value ($/t) World production USGS
49
50
51
52
53
www.cdc.gov/
55
These appear to be about 10 times lower than levels At which the fetus is susceptible In the mother
56
57
0.6 606 .01 26 Total
Tg/yr
Total
Gg/yr
NPP
Gg/yr
Sea
Gg/yr
Weather
Gg/yr
3.3 23 191 3100 Total
Tg/yr
Total
Gg/yr
Burn
Gg/yr
Fossil
Gg/yr
Mining
Gg/yr
58
59
60
61
62
63
64
DPO ≈ 23t/person
65
66
US TDO≈ 90t per capita
90 t X 6 billion people =………
67
Edmund Hillary and Tenzing Norgay summit Mount Everest, May 1953
sea level 8,848 m ≈200 km3 right circular cone
68
69