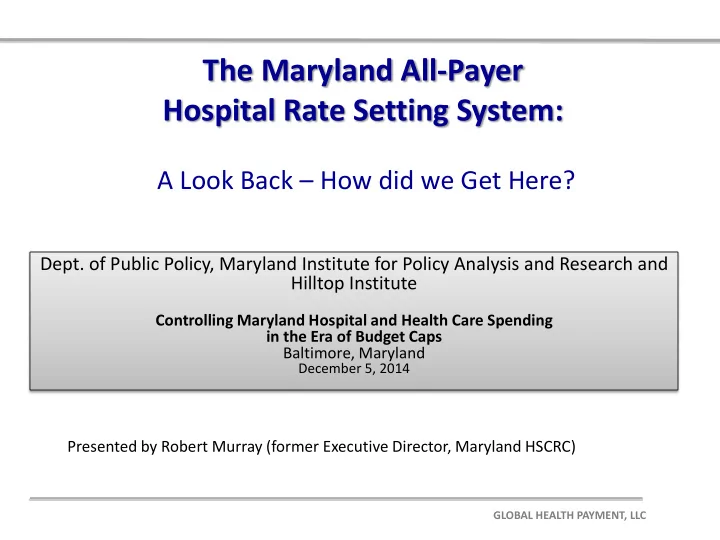
the maryland all payer hospital rate setting system
play

The Maryland All-Payer Hospital Rate Setting System: A Look Back - PowerPoint PPT Presentation

The Maryland All-Payer Hospital Rate Setting System: A Look Back How did we Get Here? Dept. of Public Policy, Maryland Institute for Policy Analysis and Research and Hilltop Institute Controlling Maryland Hospital and Health Care Spending


  1. The Maryland All-Payer Hospital Rate Setting System: A Look Back – How did we Get Here? Dept. of Public Policy, Maryland Institute for Policy Analysis and Research and Hilltop Institute Controlling Maryland Hospital and Health Care Spending in the Era of Budget Caps Baltimore, Maryland December 5, 2014 Presented by Robert Murray (former Executive Director, Maryland HSCRC) GLOBAL HEALTH PAYMENT, LLC

  2. HSCRC – the “Board Game” by Milton Bradley The Game has a lot of twists and turns and some very suspenseful moments Waiver Limbo, IPPS and lose $1.5 billion Buy docs, build, build, build – maximize revenues 2 The Long and Winding Road – A Look Back

  3. First: a Quick Overview of Hospital Rate Setting • HSCRC created in 1971 with jurisdiction over hospital costs (IP & OP facility only) with rate setting authority for commercial payers • Began negotiations with Medicare (HCFA) in 1972 for an all-payer waiver (in effect when all hospital rates set: 1977) • The “Medicare waiver” (initially a demonstration waiver) made the system “all - payer” allowing for Medicare and Medicaid • System was based on historical costs – (but a focus on outliers) • Established a prospective rate setting system - annual rate updates • Initially a system of “Unit rates by Revenue Center” • Uniform Markups of Charges over Cost • System of Financing “reasonable” Uncompensated Care” 3 GLOBAL HEALTH PAYMENT, LL C

  4. Payment Equity Hospitals nationally mark US up their charges Hospital markups 200% above cost MD Hospital markups Markup also Includes a “reasonable Provision” for hospital Uncompensated Care • HSCRC controls the “markup” of price over cost • HSCRC also p rohibits price-discrimination/cost-shifting • Maryland has the lowest markups and lowest charges in U.S. 4 Source: American Hospital Association statistics 1980 - 2009

  5. Original Waiver test was a “ per case payment relative rate ” of Growth Test” Maryland Health Services Cost Review Commission MEDICARE PAYMENT PER CASE Maryland passes the test as long MARYLAND vs. U.S. 1980 - 2001 As it grows more slowly than Medicare (i.e., can’t get back to 30% higher level) $9,000 $8,000 Maryland Payment/Case 1980 = $2,972 2001 = $8,244 $7,000 Medicare Payment per Case U.S. Payment/Case 1980 = $2,293 $6,000 2001= $7,309 $5,000 Maryland Absolute Test U.S. $4,000 Maryland growth = 177% $3,000 U.S. growth = 219% $2,000 Maryland was 30% higher than $1,000 Medicare in payment per case in 1981 Value of the Waiver in terms of $0 Enhanced Medicare and Medicaid 1980 1982 1984 1986 1988 1990 1992 1994 1996 1998 2000 Payments to Maryland = $1.5 – $2 billion Fiscal Year Per year! 5

  6. Other Features of the Baseline System • Extensive data collection clinical and financial (inpatient case mix data set the best in the world) • 1977 HSCRC changed the Basis of Payment to DRGs • First DRG-based payment system in the world • Focus on outliers led to development of the “Screens” – identifying high cost providers for corrective action • Outpatient payment – still unit rates • Strong Cost control mechanisms/policies 1977-1989 but no quality-related P4P • Maryland and all State-based Rate Setting Systems had a System of Volume Adjustments 6 GLOBAL HEALTH PAYMENT, LL C

  7. Volume Adjustment System (VAS) • Under DRG System, Hospitals have 3 Primary Incentives: • Minimize Cost Per Case • Maximize Revenue Per Case (Coding has an impact here) • Maximize Case Volumes • Volume Adjustment System: Reflect Hospital Fixed/Variable Costs • Over the Short Term (in general) Hospital Fixed Costs are about 40-60% • In absence of a Volume Adjustment, New cases: Marginal Revenue > Marginal Cost • Marginal case hospital retains 100 cents on the $ when cost is 50 cents on the $ • New Volumes add substantially to Profitability and Cash Flow Implication: Large incentive to admit more cases; Greatly Undermines Cost Control • All State Based Rate Systems in US had Volume Adjustment Question this now Given most CMS • Economically Sound: Reflects Fixed and Variable Components of Cost Experiments are all • Acts as a “Break” on incentive to do unnecessary volume About controlling Unnecessary volume Oddly – Medicare didn’t contemplate the use of a Volume Adjustment 7 GLOBAL HEALTH PAYMENT, LLC

  8. Volume Adjustment System (continued) • Volume inducing feature of FFS payment has undermined cost containment in Maryland and Nationally • Major factor behind Hospital expansionary strategies (building projects, questionable new technologies, buying docs, etc.) • Increase volumes = excess Marginal Revenues over Marginal Costs and this surplus is reinvested in expansionary strategies that again increase volumes • Particularly true for non-profit hospitals (no need to distribute profits to owners – instead use increased cash flow from volume increases to expand and generate more volumes) • Responsible for the view that “Hospitals are self -fueling, ever-expanding machines” (James Robinson, UC Berkeley) 8 GLOBAL HEALTH PAYMENT, LLC

  9. Implications: Collapse of Managed Care & Removal of VAS • Maryland VAS was effective – but policy changed over time • 1977-89: Costs treated 50%/50%: VC/FC (hospital retains 50 cents on $ for volume) • 1990-2001: Some hospitals negotiated 100% VC arrangements • Rest of the system placed on 85%/15% VC/FC (hospitals retained 85 cents on the $) • 2001: 100% VC (eliminated Volume Adjustment in 2001) • During Rate System “Redesign” – HSCRC negotiated very low update factors 2001-2004 • In exchange for low updates hospitals requested elimination of VAS • Managed care was still relatively strong in 2000 and it was thought that HMOs would continue to provide a break on unnecessary volumes • HSCRC was wrong and Hospitals responded to the changed incentives and disappearance of Managed Care by greatly increasing volumes 9 GLOBAL HEALTH PAYMENT, LL C

  10. Indexed Rates of Growth in Hospital Inpatient and Outpatient Volumes (as measured by EIPAs): 1976-2011 Indexed Growth in EIPAs 2.2 MD vs. US 2.0 Maryland EIPA Growth 1.8 1.6 1.4 1.2 US EIPA Growth 1.0 0.8 76 78 80 82 84 86 88 90 92 94 96 98 00 02 04 06 08 10 77 79 81 83 85 87 89 91 93 95 97 99 01 03 05 07 09 11 10 From the American Hospital Association Annual Statistical Guide 1976-2011

  11. Findings from “ Kalman et al.” • Researcher from Duke University published a study on the “volume response by Maryland hospitals” over the period 2001 -2008 • Findings: • With the repeal of the 85% volume adjustment, inpatient admissions had a significant relative increase from baseline of 7.8% and a significant acceleration in yearly growth from 0.8% to 2.4% • Similarly, outpatient equivalent volume experienced a significant relative increase from baseline of 16.7% and a non-significant acceleration in yearly growth from 3.4% to 4.7% • Similarly, outpatient equivalent volume experienced a significant relative increase from baseline of 16.7% and a non-significant acceleration in yearly growth from 3.4% to 4.7% • Operating revenue and operating costs increased significantly over baseline by 4.2% and 7.6%, respectively • The operating revenue yearly growth rate, which had previously outpaced the growth in operating costs (5.3% vs 4.8%), converged after the repeal (8.7% vs 8.4%) http://www.ajmc.com/publications/issue/2014/2014-vol20-n6/Removing-a-Constraint-on-Hospital-Utilization-A-Natural-Experiment-in-Maryland 11 GLOBAL HEALTH PAYMENT, LL C

  12. Findings from “ Kalman et al.” Inpatient Admissions Outpatient Equivalent Volume 13,500 6,000 5,500 12,500 4.7% Yearly Equivalent Admissions Yearly Equivalent Admissions 2.4% 5,000 11,500 4,500 10,500 4,000 0.8% 3.4% 3,500 9,500 3,000 8,500 2,500 7,500 2,000 1990 1995 2000 2005 2010 1990 1995 2000 2005 2010 Fiscal Year Fiscal Year Inpatient Admissions by Hospital Capacity Operating Costs 14,500 180,000 160,000 13,500 3.0% 8.4% Yearly Equivalent Admissions 140,000 Yearly Costs, $ thousands 12,500 120,000 11,500 100,000 2.0% 1.7% 4.8% 80,000 10,500 60,000 9,500 Hospitals generated a lot more 12.6% 40,000 8,500 Revenue and they spent it 20,000 -0.4% 7,500 0 1990 1995 2000 2005 2010 1990 1995 2000 2005 2010 Fiscal Year Fiscal Year 12 GLOBAL HEALTH PAYMENT, LL C

  13. Payment System Changes & Addressing our “Value” problem • Emphasis on Quality and Payment Changes nationally spurred a round of similar change in Maryland 2003-2011 • Quality Related Programs: • Quality-Based Reimbursement (P4P system of rewards and penalties for performing evidence-based process measures) • Maryland Hospital Acquired Conditions Policy (P4P system of significant rewards/penalties for risk adjusted rates of complications across 64 categories) • Cost/Utilization Programs: • Admission-Readmission Revenue (ARR) policy which bundled admissions and all-cause readmissions (31 of 46 hospitals adopted) • Re-instituted VAS at 85% VC and 15% FC over large opposition by hospitals • Negotiated 14 Total Patient Revenue (TPR) agreements (10 were finalized) 13 GLOBAL HEALTH PAYMENT, LL C

Download Presentation
Download Policy: The content available on the website is offered to you 'AS IS' for your personal information and use only. It cannot be commercialized, licensed, or distributed on other websites without prior consent from the author. To download a presentation, simply click this link. If you encounter any difficulties during the download process, it's possible that the publisher has removed the file from their server.

Recommend


More recommend