
SLIDE 1
October 2010 Investor Presentation
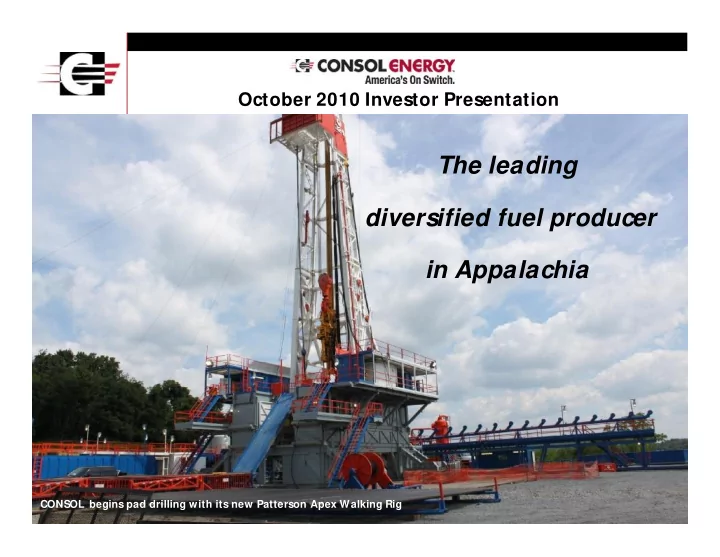
CONSOL begins pad drilling with its new Patterson Apex Walking Rig
The leading diversified fuel producer in Appalachia CONSOL begins - - PowerPoint PPT Presentation
October 2010 Investor Presentation The leading diversified fuel producer in Appalachia CONSOL begins pad drilling with its new Patterson Apex Walking Rig Cautionary Language This presentation contains state ments, estimates and projections
CONSOL begins pad drilling with its new Patterson Apex Walking Rig
The unproved reserve data contained in this presentation is based on a summary review of the title to coalbed methane and
to the coal from which many of our rights derive. As is customary in the gas industry, prior to the commencement of gas drilling operations on our properties, we conduct a thorough title examination and perform curative work with respect to significant defects. We are typically responsible for curing any title defects at our expense. This curative work may include the acquisition of additional property rights in order to perfect our
This presentation contains state ments, estimates and projections which are forward-looking statements (as defined in Section 21E of the Securities Exchange Act of 1934). These statements, which are described in detail in
annual report form 10-K filed with the Securities and Exchange Commission, involve risks and uncertainties that co uld cause actual results to differ materially from projected results. Accordingly, investors should not place undue reliance on forward-looking statements as a prediction of actual results. The forward-looking statements include estimates
reserves, projections and estimates concerning the timing and rates of return
statements unless required by the securities laws, and we caution you not to rely on them unduly. This presentation does not constitute an offer to sell any securities of CONSOL Energy Inc. The United States Securities and Exchange Commission (SEC) permits oil and gas companies, in their filings with the SEC, to disclose only proved reserves that a company has demonstrated by actual production
formation tests to be economically and legally producible under existing economic and
conditions. We use certain terms in this presentation, such as “unproved reserves and/ or unproved resources” that the SEC's guidelines strictly prohibit us from including in filings with the SEC. We also caution you that the SEC views such “unproved reserves and/ or unproved resources” estimates as inherently unreliable and these estimates may be misleading to investors unless the investor is an expert in the gas industry. In this presentation, the term “unproved reserves and/ or unproved resources” refers to gas that we believe is economically recoverable, based
2
3
4
5
Bailey M ine Overland Belt
6
7
Photo courtesy of Allegheny Energy
8
9 Quarter Ended June 30, 2010
Total Coal Sales (millions of tons) 1.0 0.7 14.2 Average Realized Price Per Ton – Company Produced $151.34 $75.52 $53.97 Total Cost Per Ton, before DD&A $59.71 $36.51 $41.44 DD&A Per Ton $4.53 $4.37 $4.87 Total Cost Per Ton – Company Produced $64.24 $40.88 $46.31 Average Margin Per Ton, before DD&A $91.63 $39.01 $12.53 Sales (millions of tons) times Average Margin Per Ton, before DD&A ($ MM)
10
11
1,570 1,400 742 730 720 652 585 584 500 492 350 343 280 250 250 250 229 170 147 120 108 88
200 400 600 800 1,000 1,200 1,400 1,600 1,800 CHK RRC Pro Forma CNX TLM NFG East STO ATLS EQT D Chief XCO XTO / XOM APC CNX UPL EOG COG SW N Antero CRZO CLR
Source: As calculated by CONSOL Energy based on public filings.
Net Acres (000’s)
12
13
Former Dominion M arcellus Acreage Legacy CONSOL Energy M arcellus Acreage
Central Pa. Ops
SW Pa. Ops WV Ops
14
Former Dominion M arcellus Acreage Legacy CONSOL Energy M arcellus Acreage
50 100 150 200 250 300 350 400 2010 2015
Marcellus Other
142 Annualized Bcf 350 Bcf
15
170 Bcf
2011 2012 2013 2014
Annual wells / rig 11 13 16 17 17 17
After-Tax IRR At Various Henry Hub Prices M argin Analysis
(1) Assumes 3,000 ft. laterals (2) Difference represents basis premium and gas quality characteristics (3) Includes production loss (shrink) of 3.5%
16
($M M , except as noted)
Gross EUR (Bcfe)
(1)
4.3 NRI 87.5% Net EUR (Bcfe) 3.7 Drilling Cost
(1)
$1.9 Completion Cost
(1)
1.3 Total D&C $3.2 Gathering 0.4 Land & Title 0.1 Total $3.7
M argin Analysis
($ / M cfe, except as noted)
Henry Hub Cash Price ($ / M M BTU) $5.00 Realized Price ($ / M cfe)
(2)
5.67 Lease Operating Expense $1.26 Production Taxes 0.28 Gross M argin $4.13 Total D&C,G,L Cost ($ / M cfe)
(3)
$1.02 ATAX IRR 29.5% Henry Hub Price Required for 20% ATAX IRR $4.27
4.0% 6.0% 8.0% 10.0% 12.0% 14.0% 16.0% 18.0% 20.0% 22.0% 24.0% 26.0% 28.0% 30.0% $3.00 $3.50 $4.00 $4.50 $5.00
Internal Rate of Return %
Henry Hub Cash Price ($ / MMBTU) Well ATAX IRR Comparison - Type Curve Analysis
High Case Base Case
17
16.2 38.2 18.1 41.1 1.9 2.9 38.2 16.2
Proved Reserves (Tcfe) Total Unproved Reserves and Potential Resource Base (Tcfe)
1.9 2.9
Note: Total Unproved Reserves and Potential Resource Base calculated using mid-point of CONSOL Energy estimates.
Pre-Acquisition Post-Acquisition Pre-Acquisition Post-Acquisition Pre-Acquisition Post-Acquisition
Proved Reserves Total Unproved Reserves and Potential Resource Base Total Resource Potential
18
19
CONSOL begins pad drilling with its new Patterson Apex Walking Rig