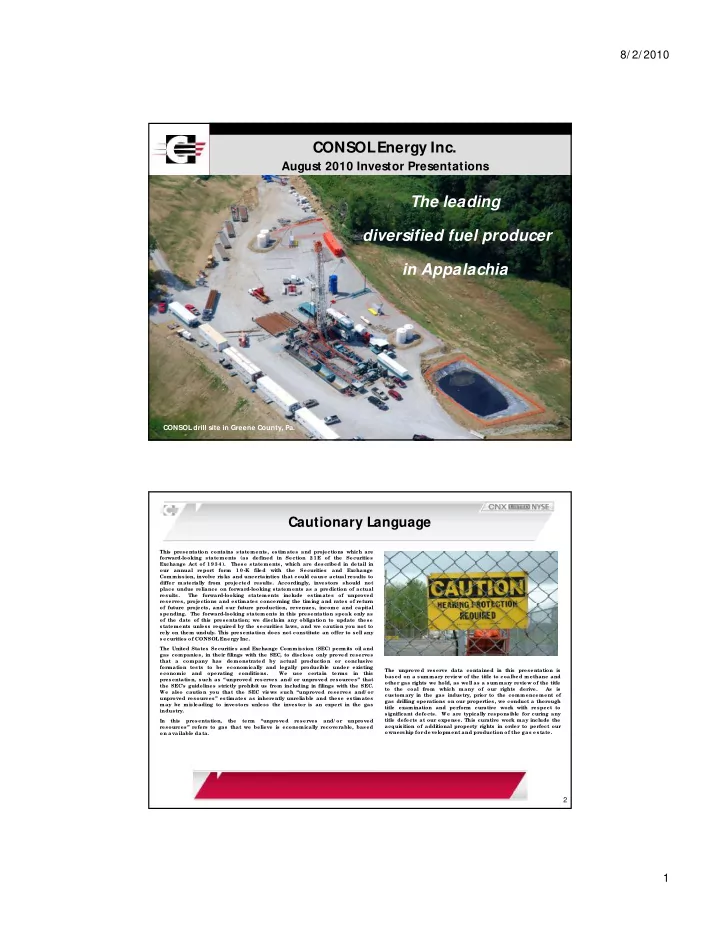
the leading diversified fuel producer in appalachia
play

The leading diversified fuel producer in Appalachia CONSOL drill - PDF document

8/ 2/ 2010 CONSOL Energy Inc. August 2010 Investor Presentations The leading diversified fuel producer in Appalachia CONSOL drill site in Greene County, Pa. Cautionary Language This presentation contains statements, estimates and projections


  1. 8/ 2/ 2010 CONSOL Energy Inc. August 2010 Investor Presentations The leading diversified fuel producer in Appalachia CONSOL drill site in Greene County, Pa. Cautionary Language This presentation contains statements, estimates and projections which are forward-looking statements (as defined in Section 2 1 E of the Securities Exchange Act of 1 9 3 4 ). These statements, which are described in detail in our annual report form 1 0 -K filed with the Securities and Exchange Commission, involve risks and uncertainties that could cause actual results to differ materially from projected results. Accordingly, investors should not place undue reliance on forward-looking statements as a prediction of actual results. The forward-looking statements include estimates of unproved reserves, projections and estimates concerning the timing and rates of return of future projects, and our future production, revenues, income and capital spending. The forward-looking statements in this presentation speak only as of the date of this presentation; we disclaim any obligation to update these statements unless required by the securities laws, and we caution you not to rely on them unduly. This presentation does not constitute an offer to sell any s e curities of CONSOLEnergy Inc. The United States Securities and Exchange Commission (SEC) permits oil and gas companies, in their filings with the SEC, to disclose only proved reserves that a company has demonstrated by actual production or conclusive formation tests to be economically and legally producible under existing The unprove d reserve data contained in this presentation is economic and operating conditions. We use certain terms in this based on a summary review of the title to coalbed methane and presentation, such as “unproved reserves and/ or unproved resources” that other gas rights we hold, as well as a summary review of the title the SEC's guidelines strictly prohibit us from including in filings with the SEC. to the coal from which many of our rights derive. As is We also caution you that the SEC views such “unproved reserves and/ or customary in the gas industry, prior to the commencement of unproved resources” estimates as inherently unreliable and these estimates gas drilling operations on our properties, we conduct a thorough may be misleading to investors unless the investor is an expert in the gas title examination and perform curative work with respect to industry. significant defects. We are typically responsible for curing any title defects at our expense. This curative work may include the In this presentation, the term “unproved reserves and/ or unproved acquisition of additional property rights in order to perfect our resources” refers to gas that we believe is economically recoverable, based ownership for de velopment and production of the gas e state. on available data. 2 1

  2. 8/ 2/ 2010 CONSOL ’s Coal Operations Ran Well in Q1 and Q2 � Safety was improved � Internal production goals were achieved � T otal production costs were flat from Q1 to Q2 CONSOL ’s mines are poised to meet higher commitments for the remainder of 2010. 3 Coal Division’s Unit Costs Vary With Production Levels 50 $47.38 $44.40 45 40 35 30 2010 Quarterly Production 25 (MM tons) Expected Unit Costs ($/ton) 20 16.5 15.9 14.9 15.2 15 10 5 0 1 2 3 4 2010 Quarters Total coal production costs in 2010 Q1 and Q2 were each $706 million. 4 2

  3. 8/ 2/ 2010 CONSOL ’s M arketing Achievements in Q2 � Generated a record $1 billion from coal sales � Loaded a record 43 vessels with 3.3 mm tons � Booked 300,000 tons of high-vol coal for Asia in 2H at $76 per ton � Booked 200,000 tons of CONSOL ’s 100%-owned Baltimore Terminal thermal coal for Europe in 2H at $61 per ton CONSOL ’s marketers also booked meaningful volumes at higher prices for 2011 and 2012. 5 CONSOL ’s New BM X M ine Opens in Late 2013 � 5 MM tons/ year of low-cost NAPP coal � Potential Markets: � Asian mills � European generators � Brazilian mills � Domestic generators CONSOL ’s Bailey Prep Plant will expand to serve the BM X M ine CONSOL is expanding production of its premium product to meet the growing demands of world markets. 3

  4. 8/ 2/ 2010 CONSOL Also Looking to M onetize CAPP M et Reserves � Amonate, Elk Creek, and Itmann properties � 5 MM tons/ year of low- vol, medium-vol, and high-vol � Potential EBITDA of $350 MM, assuming $150 per ton sales price CONSOL is assessing options, including joint-venturing, outright sale, and possible sole development. New Developments in CONSOL ’s Gas Division � Gas Division had Q2 net income of $33.5 million � 3 Rigs Running in the Marcellus by the end of August, w/ 4 rigs running by end of 2010 CONSOL ’s New Patterson Apex Walking Rig � Signed for 200 MMcf of takeaway capacity on Dominion CONSOL ’s gas production in Q2 grew 42%, to a record 31.9 Bcf. 8 4

  5. 8/ 2/ 2010 CONSOL Issues 2011 Production Guidance of 170 Bcf 400 350 Bcf 350 300 250 Marcellus 170 Bcf 200 142 Annualized Bcf 150 100 Other 50 0 2010 2015 2010 2011 2012 2013 2014 2015 Gross M arcellus Wells Drilled 22 63 131 165 170 170 Total M arcellus Rigs 2 5 8 10 10 10 Annual wells / rig 11 13 16 17 17 17 CONSOL now expects 2011 production to be higher than earlier forecast. 9 CONSOL has Three M arcellus Shale Operating Areas PA Central Pa. Ops OH SW Pa. Ops MD WV Ops VA WV Former Dominion Marcellus Acreage Legacy CONS OL Energy Marcellus Acreage CONSOL has 750,000 Net Acres in M arcellus Shale. 10 5

  6. 8/ 2/ 2010 CONSOL has a Leading Acreage Position and … . . . Not All M arcellus Acres Are Equal Net Acres (000’s) 1,800 • 98% of the acres are HBP (held by production) 1,570 • Have an average NRI (net revenue interest) of 89% 1,600 • Have essentially no drilling commitments 1,400 1,400 1,200 1,000 750 800 742 730 720 652 585 584 600 500 492 400 350 343 280 250 250 250 229 170 200 147 120 108 88 0 CNX CHK RRC Pro TLM NFG East STO ATLS EQT D Chief XCO XTO / APC CNX UPL EOG COG SWN Antero C RZO CLR Forma XOM CNX CONSOL can drill for economics, not to hold leases. 11 Source: As calculated by CONSOL Energy based on public filings. CONSOL ’s Gas Reserve Potential Has Doubled T otal Unproved Reserves and T otal Resource Potential Proved Reserves Potential Resource Base 41.1 38.2 2.9 1.9 38.2 18.1 16.2 16.2 2.9 1.9 Pre-Acquisition Post-Acquisition Pre-Acquisition Post-Acquisition Pre-Acquisition Post-Acquisition Proved Reserves (Tcfe) Total Unproved Reserves and Potential Resource Base (Tcfe) CONSOL has extraordinary current and long-term opportunities. 12 Note: Total Unproved Reserves and Potential Resource Base calculated using mid-point of CONSOL Energy estimates. 6

  7. 8/ 2/ 2010 CONSOL Energy’s Value Proposition Sewickley Coal Seam Sewickley Coal Seam - CBM – 900 feet – 900 feet Pittsburgh Coal Seam Pittsburgh Coal Seam - CBM – 1,000 feet – 1,000 feet Freeport Coal Seam Freeport Coal Seam - CBM – 1,650 feet – 1,650 feet Upper Devonian Sands – 1,750 - 5,500 feet M arcellus Shale – 7,000+ feet Oriskany Tight Sands, Utica and Trenton Black River Shales – 8,000+ feet CONSOL has the largest concentration of Appalachian energy assets. 13 Illustrative M arcellus Well Economics After-Tax IRR At Various Prices ($M M , except as noted) 1 00% (1) Gross EUR (Bcfe) 4.3 95% NRI 87.5% 90% Net EUR (Bcfe) 3.7 85% Drilling Cost (1) $1.9 80% Complet ion Cost (1) 1.3 75% Total D&C $3.2 70% Internal Rate of Return (%) Gathering 0.4 65% Land & Tit le 0.1 60% Total $3.7 55% 50% M argin Analysis 45% M argin Analysis 40% ($ / M cfe, except as noted) 35% Henry Hub Cash Price ($ / M M BTU) $5.00 Realized Price ($ / M cfe) (2) 5.67 30% 25% Lease Operating Expense $1.26 20% Production Taxes 0.28 1 5% Gross M argin $4.13 (3) 1 0% Tot al D&C,G,L Cost ($ / M cfe) $1.02 5% ATAX IRR 29.5% 0% Henry Hub Price Required for 20% ATAX IRR $4.27 $2.00 $2.50 $3.00 $3.50 $4.00 $4.50 $5.00 $5.50 $6.00 $6.50 $7.00 $7.50 $8.00 Henry Hub Cash Price ($ / MMBTU) CONSOL expect a 29.5% After-Tax IRR at $5.00 / M M BTU. 14 (1) Assumes 3,000 ft. laterals (2) Difference represents basis premium and gas quality characteristics (3) Includes production loss (shrink) of 3.5% 7

  8. 8/ 2/ 2010 Latest Five Wells Appear to be Very Good All in Greene County, Pa.: • EURs (p-50 case) range from 5.5 Bcf to 9.9 Bcf • Laterals average 2,200 feet • D&C Costs average $ 4.2 million • Projected after-tax IRRs range from 44% to 70% CONSOL is achieving results much better than the type curve would suggest. 15 CONSOL Energy’s Gas Hedge Position CONSOL Energy has one of the best gas hedge books in the industry: 2010 2011 2012 T otal Y early Production (Bcf) 141 170 NA VolumesHedged (Bcf) 48.4 22.6 15.1 Average Hedge Price ($/ M cf) $7.85 $6.84 $6.84 CONSOL ’s low cost position allows for flexibility in hedging. 16 8

Download Presentation
Download Policy: The content available on the website is offered to you 'AS IS' for your personal information and use only. It cannot be commercialized, licensed, or distributed on other websites without prior consent from the author. To download a presentation, simply click this link. If you encounter any difficulties during the download process, it's possible that the publisher has removed the file from their server.

Recommend


More recommend