
SLIDE 1
t r a n s f o r m a t i o n s
MCR3U: Functions
The Inverse of a Function
- J. Garvin
Slide 1/17
t r a n s f o r m a t i o n s
The Inverse of a Function
A relation associates elements in the domain (independent variable) with those in the range (dependent variable). When the dependent and independent variables (usually x and y) are swapped, the resulting relation is the inverse of the original relation. Since functions are special cases of relations, the same definition applies. Swapping the two variables means that the domain of a function becomes the range of its inverse, and the range of a function becomes the domain of its inverse. For example, if a function has a domain of {x ∈ R | x > 4} and a range of {f (x) ∈ R | x ≤ 2}, then the inverse will have a domain of {x ∈ R | x ≤ 2} and a range of {f (x) ∈ R | x > 4}.
- J. Garvin — The Inverse of a Function
Slide 2/17
t r a n s f o r m a t i o n s
The Inverse of a Function
Example
Given the relation R = {(3, 2), (−1, 4), (5, 0)}, Determine its inverse, I, and state the domain and range of I. Swapping the values of x and y gives the inverse relation I = {(2, 3), (4, −1), (0, 5)}. Since the domain and range of R are D : {3, −1, 5} and R : {2, 4, 0}, the domain and range of I are D : {2, 4, 0} and R : {3, −1, 5}.
- J. Garvin — The Inverse of a Function
Slide 3/17
t r a n s f o r m a t i o n s
The Inverse of a Function
Graphically, the inverse of a function is a reflection in the line y = x. This makes it easy to graph a function’s inverse by swapping the x- and y-coordinates for every point, and plotting the resulting new points. This is often the best method to use when given a graph.
- J. Garvin — The Inverse of a Function
Slide 4/17
t r a n s f o r m a t i o n s
The Inverse of a Function
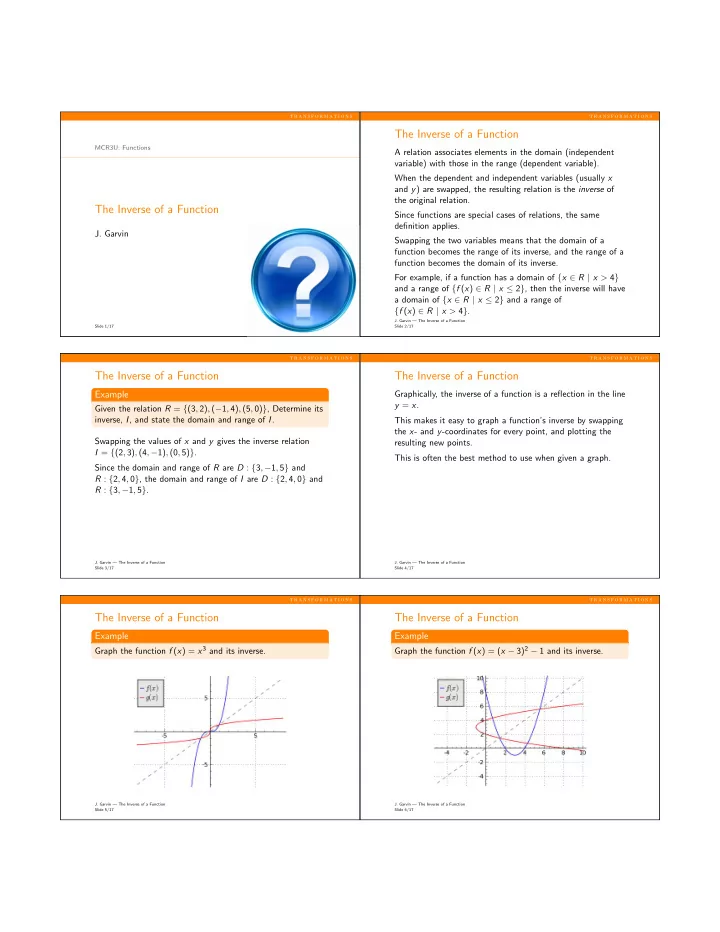
Example
Graph the function f (x) = x3 and its inverse.
- J. Garvin — The Inverse of a Function
Slide 5/17
t r a n s f o r m a t i o n s
The Inverse of a Function
Example
Graph the function f (x) = (x − 3)2 − 1 and its inverse.
- J. Garvin — The Inverse of a Function
Slide 6/17