the idea outline
play

The idea Outline Definition Definition ADM: an IR effectiveness - PDF document

Evaluating ADM on a Three-Level Evaluating ADM on a FOUR FOUR-Level Relevance Scale Document Set Relevance Scale Document Set from NTCIR from NTCIR Vincenzo Della Mea, Luca Di Gaspero, Stefano Mizzaro* Stefano Mizzaro* Vincenzo Della Mea,


  1. Evaluating ADM on a Three-Level Evaluating ADM on a FOUR FOUR-Level Relevance Scale Document Set Relevance Scale Document Set from NTCIR from NTCIR Vincenzo Della Mea, Luca Di Gaspero, Stefano Mizzaro* Stefano Mizzaro* Vincenzo Della Mea, Luca Di Gaspero, Stefano Mizzaro* Stefano Mizzaro* Department of Mathematics and Computer Science Department of Mathematics and Computer Science University of Udine University of Udine http://www.dimi.uniud.it/~mizzaro http://www.dimi.uniud.it/~mizzaro mizzaro@dimi.uniud.it mizzaro@dimi.uniud.it NTCIR-4, Tokyo, 2 June 2004 NTCIR-4, Tokyo, 2 June 2004 The idea Outline � Definition Definition � � ADM: an IR effectiveness measure based on � The URS/SRS plane The URS/SRS plane � continuous relevance � ADM (Average Distance Measure) ADM (Average Distance Measure) � � Relevance � Examples Examples � � Binary {0,1} � Conceptual analysis � Categories {low, medium, high} � Problems with precision and recall � Continuous [0..1] � Retrieval: too (boolean, vector space, …) � Experimental analysis � V. Della Mea, S. Mizzaro (2004). Measuring � TREC data Retrieval Effectiveness: A New Proposal and a First � ADM is as good as TREC measures Experimental Validation, JASIST , 55(6):530-543 � ADM is effective with less data than TREC measures � Draft, p. 30, supplement v. 2 � NTCIR data: preliminary results S. Mizzaro - ADM 3 S. Mizzaro - ADM 4 
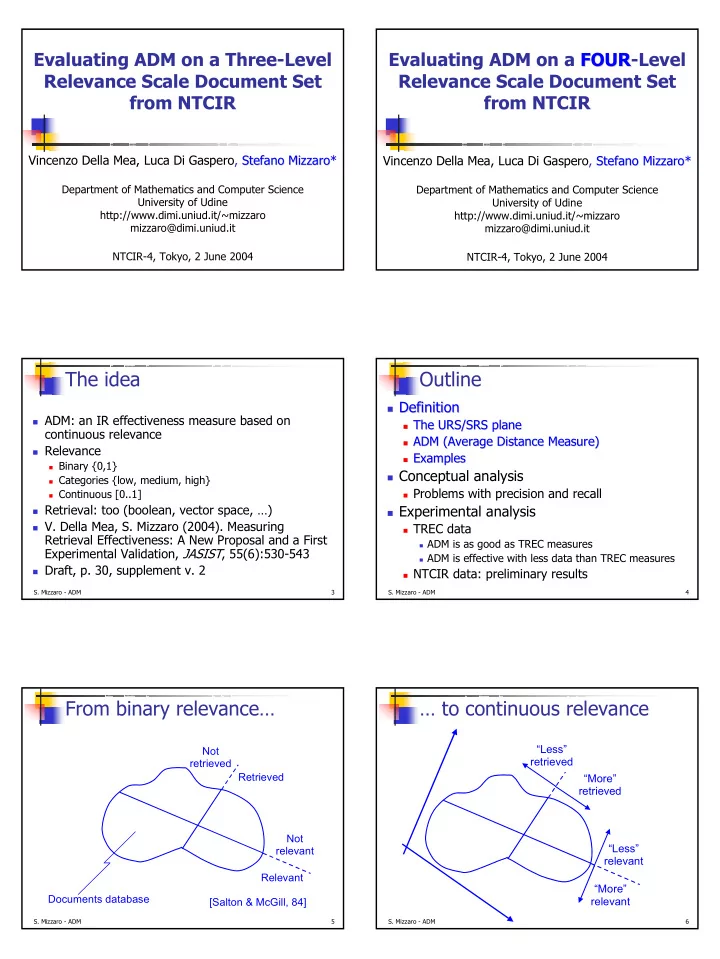
From binary relevance… … to continuous relevance “Less” Not retrieved retrieved Retrieved “More” retrieved Not “Less” relevant relevant Relevant “More” Documents database relevant [Salton & McGill, 84] S. Mizzaro - ADM 5 S. Mizzaro - ADM 6

  2. The URS/SRS plane SRS and URS “Less” “More” � SRS (System System Relevance Score) relevant relevant SRS Documents 1.0 � Relevance value given by the IRS System � URS (User User Relevance Score) Relevance Score “More” � Relevance value given by the user retrieved α β � Real numbers, in the [0..1] range 0.5 “Less” � Different from retrieved � RSV (Retrieval Status Value), insensible to rank- s preserving transformations User γ δ 0 Relevance URS � Estimate of the probability of relevance u 1.0 0 0.5 Score S. Mizzaro - ADM 7 S. Mizzaro - ADM 8 A step backward: P & R The “right” places… “Less” “More” P = RetRel /(RetRel+RetNRel) “Less” “More” relevant relevant SRS relevant SRS relevant R = RetRel /(RetRel+NRetRel) 1.0 1.0 Retrieved & Retrieved & nonrelevant? relevant? “More” “More” retrieved retrieved α β 0.5 0.5 “Less” “Less” retrieved Nonretrieved& retrieved Nonretrieved nonrelevant? & relevant? s γ δ 0 0 URS URS 0.5 1.0 0 u 1.0 0 0.5 S. Mizzaro - ADM 9 S. Mizzaro - ADM 10 ADM: ADM: Average Distance Measure Average Distance Measure SRS 1.0 = − ∑ ( ) ( ) − SRS d URS d q i q i ∈ d D ADM 1 i q D � ADM for one query: 1 - average distance between SRS and URS over all (?) the documents � ADM for one IRS for one IRS: average over some queries 0 URS 1.0 0 S. Mizzaro - ADM 11 S. Mizzaro - ADM 12

  3. An example Outline Docs. d1 d2 d3 ADM SRS SRE � Definition URS 0.8 0.4 0.1 1.0 1.0 � The URS/SRS plane 0.9 0.9 IRS1 0.9 0.5 0.2 0.9 � ADM (Average Distance Measure) 0.8 0.8 IRS2 1.0 0.6 0.3 0.8 � Examples IRS3 0.8 0.4 1.0 0.7 0.6 0.6 � Conceptual analysis Conceptual analysis � 0.5 0.5 � Problems with precision and recall Problems with precision and recall � 0.4 0.4 � Experimental analysis 0.3 0.3 � TREC data 0.2 0.2 � ADM is as good as TREC measures 0 0 � ADM is effective with less data than TREC measures URS 0 0 0.1 0.1 0.4 0.4 0.8 0.8 1.0 1.0 � NTCIR data: preliminary results d3 d2 d1 S. Mizzaro - ADM 13 S. Mizzaro - ADM 14 ADM vs. P & R Hyper-sensitiveness: 3 similar IRS P R E ADM IRS1 0.67 1.0 0.84 0.83 � Precision and recall are: IRS2 1.0 0.5 0.75 0.83 SRS IRS3 0.5 0.5 0.5 0.826 � Hyper-sensitive 1.0 � to relevant/nonrelevant and retrieved/nonretrieved thresholds � (i.e., 0.49 and 0.51 are two very similar values, but the outcome is very different…) unstable 0.5 � Insensitive 0.49 stable � to variations within particular areas (0.99 and 0.51 are very different, but the outcome is the same…) 0 URS 0.5 1.0 0 0.49 S. Mizzaro - ADM 15 S. Mizzaro - ADM 16 Insensitiveness: 2 different IRS Problem: arbitrary & wrong thresholds SRS SRS SRS 1.0 unstable 1.0 1.0 Over Evaluated stable Retrieved & Retrieved & nonrelevant? relevant? t 0.5 0.5 0.5 Correctly P R E ADM Evaluated Nonretrieved Nonretrieved IRS1 1 1 1 1 & & relevant? IRS2 1 1 1 0.5 nonrelevant? Under Evaluated 0 0 0 0.5 URS 1.0 0.5 1.0 0 0 0 0.5 1.0 URS URS S. Mizzaro - ADM 17 S. Mizzaro - ADM 18

  4. ADM variants What do we need for ADM? 1.0 � Ideal situation: Continuous SRS & URS 0.5 SRS � ADM for precision and � Worst situation: “binarized” ADM 1.0 0 recall 0 0.5 1.0 � All the documents in (0,0),(0,1),(1,0),(1,1) � R: on the over-evaluated � Docs in (0,1) e (1,1) only: R documents only 1.0 � Docs in (1,0) e (1,1) only: P � P: on the under-evaluated 0.5 � Intermediate situations: “discrete” ADM documents only 0 � Categories, combinations, … � ADM with non continuous 0 0.5 1.0 SRSs and URSs 1.0 0 1.0 1.0 � … URS 0 1.0 0.5 0.5 0.5 0 0 0 0 0.5 1.0 0 0.5 1.0 0 0.5 1.0 S. Mizzaro - ADM 19 S. Mizzaro - ADM 20 Outline ADM on TREC data � Definition � ADM Variants: � The URS/SRS plane � (simplifying…) � ADM (Average Distance Measure) � URSs are binary (either relevant or nonrelevant) � Examples � SRSs are not reliable → We used the ranking � Conceptual analysis � Problems with precision and recall Rank 1st 2nd 3rd 4th … 999th 1000th 1001st … � Experimental analysis Experimental analysis � SRS 1.0 0.999 0.998 0.997 … 0.002 0.001 0.000 … � TREC data TREC data � � ADM is as good as TREC measures ADM is as good as TREC measures � � ADM is effective with less data than TREC measures ADM is effective with less data than TREC measures � � NTCIR data: preliminary results NTCIR data: preliminary results � S. Mizzaro - ADM 21 S. Mizzaro - ADM 22 Correlations (graphically) ADM is as good as TREC ADM' By R-Prec ADM' By Rel-Ret ADM' By AvgPrec measures 0,54 0,54 0,54 0,52 0,52 0,52 ADM Rel-Ret AvgPrec R-Prec ADM' ADM' ADM' 0,50 0,50 0,50 0,48 ADM 1 0,48 0,48 0,46 Rel-Ret 0.891 0.891 1 0,46 0,46 0,20 0,30 0,40 0,00 0,10 0 1000 2000 3000 0,00 0,10 0,20 0,30 0,40 AvgPrec Rel-Ret R-Prec ADM" By R-Prec AvgPrec 0.876 0.876 0.824 1 ADM" By Rel-Ret ADM" By AvgPrec 0,61 0,61 0,61 0,59 0,59 0,59 R-Prec 0.844 0.844 0.807 0.902 1 0,57 0,57 0,57 0,55 0,55 0,55 ADM" ADM" ADM" 0,53 � Kendall Correlations 0,53 0,53 0,51 0,51 0,51 0,49 0,49 0,49 0,47 0,47 0,47 0,20 0,30 0,40 0,00 0,10 0 1000 2000 3000 0,00 0,10 0,20 0,30 0,40 AvgPrec S. Mizzaro - ADM 23 Rel-Ret R-Prec

  5. ADM is effective with less data ADM on NTCIR-4 data than TREC measures � Correlations between “global” ADM (on the � PRELIMINARY RESULTS PRELIMINARY RESULTS! � TREC pool docs.) and ADM on subsets: � URS: Set (Ret, Rel, topics) N. docs ADM � 4 categories → 4 values (…) (approx.) � SRS: (100%, 100%, 100%) 53000 1 � Continuous scores → Linear normalization into (100%, 100%, 50%) 26000 0.852 0.852 SRSs (50%, 50%, 100%) 26000 0.910 0.910 � Rank, as in TREC (10% 10% 100%) 5000 0.802 0.802 (50% 50% 50%) 13000 0.807 0.807 (100% 0% 100%) 50000 0.935 0.935 S. Mizzaro - ADM 25 S. Mizzaro - ADM 26 URS and SRS distributions: …and in practice (good)… in theory… URS S A B C Docs S. Mizzaro - ADM 27 S. Mizzaro - ADM 28 …and bad Some results: low correlations… � No correlation between ADM and standard measures � Standard measures are not sensible to how well an IRS approximates the URS distribution � Good IRS according to standard measures = Good rank � Good IRS according to ADM = Good approximation of the URS distribution shape S. Mizzaro - ADM 29 S. Mizzaro - ADM 30

  6. …and some high correlations Summary � Definition � Rank-based ADM � The URS/SRS plane � On the first N retrieved documents � ADM (Average Distance Measure) � Examples � Conceptual analysis N 5 10 20 50 � Problems with precision and recall AvgPrec 0.747 0.792 0.8 0.788 � Experimental analysis � TREC data R-Prec 0.755 0.802 0.816 0.799 � ADM is as good as TREC measures � ADM is effective with less data than TREC measures � NTCIR data: preliminary results S. Mizzaro - ADM 31 S. Mizzaro - ADM 32 Future work � Carefully analyze NTCIR-4 data � A proposal � IRSs participating in next NTCIR-5 could be evaluated by ADM too � SRSs normalized in [0..1] � Carefully decide how to compute the SRSs � Try to better approximate the URS distribution � Continuous URS? � Distributed IR, data fusion, meta-search, … S. Mizzaro - ADM 33

Download Presentation
Download Policy: The content available on the website is offered to you 'AS IS' for your personal information and use only. It cannot be commercialized, licensed, or distributed on other websites without prior consent from the author. To download a presentation, simply click this link. If you encounter any difficulties during the download process, it's possible that the publisher has removed the file from their server.

Recommend


More recommend