
SLIDE 1
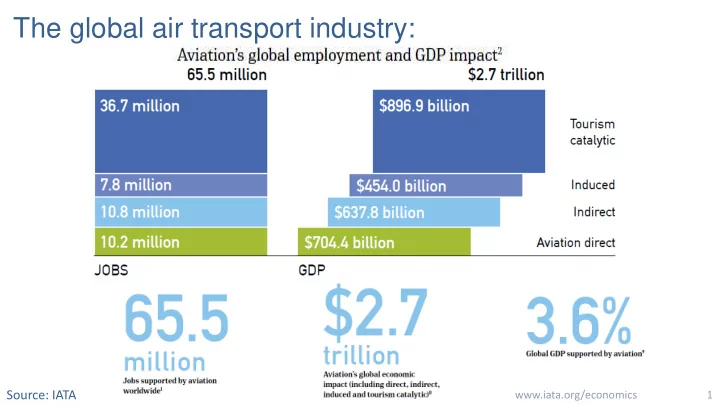
The global air transport industry:
1
Source: IATA
www.iata.org/economics
The global air transport industry: Source: IATA - - PowerPoint PPT Presentation
The global air transport industry: Source: IATA www.iata.org/economics 1 The global industry outlook remains bright 3.5% Average annual growth in global air passenger journeys over the next 20 years 2.0x The number of air passenger
1
Source: IATA
www.iata.org/economics
2 www.iata.org/economics
Source: IATA/Tourism Economics
Average annual growth in global air passenger journeys
The number of air passenger journeys in 2037 compared with today
Source: IATA/Tourism Economics
3
www.iata.org/economics
4
Source: ATAG
www.iata.org/economics
Source: IATA/Oxford Economics
www.iata.org/economics
5
334 135
100 150 200 250 300 350 400 2017 2019 2021 2023 2025 2027 2029 2031 2033 2035 2037
No Policy Change Policy Stimulus & Market Liberalisation Pick-up in Protectionism
million passengers per year (O-D basis)
6
Source: ATAG
www.iata.org/economics
7
Source: IATA/Tourism Economics
www.iata.org/economics
Source: IATA/Tourism Economics
www.iata.org/economics
8
9 www.iata.org/economics
Source: IATA/Oxford Economics 1 2 3 4 5 6 7 8 9 10
2017 2019 2021 2023 2025 2027 2029 2031 2033 2035 2037 Egypt
Tanzania Mauritius Ethiopia Kenya Tunisia Nigeria Algeria Morocco Egypt Nigeria Algeria Kenya Ethiopia Tanzania Tunisia Morocco Sudan
10 www.iata.org/economics
Source: IATA/Oxford Economics 200 400 600 800 1,000 1,200 1,400 1,600 1,800
2017 2018 2019 2020 2021 2022 2023 2024 2025 2026 2027 2028 2029 2030 2031 2032 2033 2034 2035 2036 2037
African Population in Million
Total population evolution: Africa
11 www.iata.org/economics
Source: IATA/Oxford Economics 500 1,000 1,500 2,000 2,500
2017 2018 2019 2020 2021 2022 2023 2024 2025 2026 2027 2028 2029 2030 2031 2032 2033 2034 2035 2036 2037
African per Capita GDP in Real USD
Per capita GDP evolution: Africa
12 www.iata.org/economics
Source: IATA/Oxford Economics 10,000 20,000 30,000 40,000 50,000 60,000 Egypt Morocco Ethiopia Kenya Nigeria South… Tanzania
Number of passengers per year (‘000)
Number of passengers in African countries with strong airline industry 2017 2037
13 www.iata.org/economics
Source: IATA/Oxford Economics
3.7 2.3 6.4 6.2 5.4 3.8 6.3 4.6
1 2 3 4 5 6 7
Compound annual growth rate (CAGR) for passengers
Passenger average yearly growth rate for period 2017-2037 Egypt Morocco Ethiopia Kenya Nigeria South Africa Tanzania Africa
Source: UNWTO
www.iata.org/economics
14
15 www.iata.org/economics
Source: SRS Analyser
16 www.iata.org/economics
Source: SRS Analyser
17 www.iata.org/economics
Source: SRS Analyser
18 www.iata.org/economics
Source: SRS Analyser
Source: IATA Economics using data from ICAO, The Airline Analyst, IATA forecasts
4% 9% N America Europe Asia Pacific Middle East L America Africa Net post-tax profit margins 2015 2016 2017 2018
www.iata.org/economics 20
Source: IATA
0% 2%
0.0 0.5 2008 2009 2010 2011 2012 2013 2014 2015 2016 2017 2018f Net profit (Left axis) US$bn
Airline Cost Drivers in Africa
0% 2% 4% 6% Station expenses Flight crew salaries and expenses Passenger services
Other expenses (flight operations) Depreciation and amortization Flight equipment insurance Other operating expenses Flight equipment rentals Ticketing, sales and promotion Aircraft fuel and oil Flight equipment maintenance and overhaul User charges
Percentage points difference in shares of total regional costs.
Differences in cost sources: Africa vs Industry
The 0% line indicates the industry average. Lower than industry average Higher than industry average
How IATA initiatives impact cost-drivers in Africa
0% 2% 4% 6% Station expenses Flight crew salaries and expenses Passenger services Other expenses (flight operations) Depreciation and amortization Flight equipment insurance Other operating expenses Flight equipment rentals Ticketing, sales and promotion Aircraft fuel and oil Flight equipment maintenance and overhaul User charges Percentage points difference in shares of total regional costs.
Differences in cost sources: Africa vs Industry
The 0% line indicates the industry average. Lower than industry Higher than industry average
ASA best practice clauses Airport Privatization Efforts Standards & initiatives related to distribution issues Smarter Regulation Advocacy