
SLIDE 1
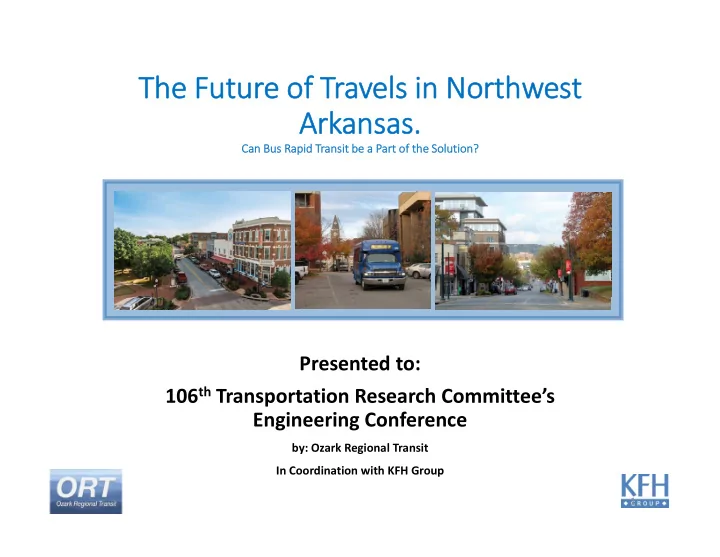
The Future of Travels in Northwest Arkansas.
Can Bus Rapid Transit be a Part of the Solution?
Presented to: 106th Transportation Research Committee’s Engineering Conference
by: Ozark Regional Transit In Coordination with KFH Group
1
The Future of Travels in Northwest Arkansas. Can Bus Rapid Transit - - PowerPoint PPT Presentation
The Future of Travels in Northwest Arkansas. Can Bus Rapid Transit be a Part of the Solution? Presented to: 106 th Transportation Research Committees Engineering Conference by: Ozark Regional Transit In Coordination with KFH Group 1
Can Bus Rapid Transit be a Part of the Solution?
by: Ozark Regional Transit In Coordination with KFH Group
1
71 Business Transit Corridor Study
71 Business Transit Corridor Study
71 Business Transit Corridor Study
71 Business Transit Corridor Study
5
71 Business Transit Corridor Study
71 Business Transit Corridor Study
71 Business Transit Corridor Study
444,600
209,000
71 Business Transit Corridor Study
71 Business Transit Corridor Study
71 Business Transit Corridor Study
platforms, using electronic signage and fare payment systems
71 Business Transit Corridor Study
71 Business Transit Corridor Study
71 Business Transit Corridor Study
71 Business Transit Corridor Study
71 Business Transit Corridor Study
71 Business Transit Corridor Study 71 Business Transit Corridor Study
71 Business Transit Corridor Study
71 Business Transit Corridor Study
20
71 Business Transit Corridor Study
71 Business Transit Corridor Study
71 Business Transit Corridor Study
23
71 Business Transit Corridor Study
71 Business Transit Corridor Study
71 Business Transit Corridor Study
71 Business Transit Corridor Study
71 Business Transit Corridor Study
71 Business Transit Corridor Study
71 Business Transit Corridor Study
71 Business Transit Corridor Study
71 Business Transit Corridor Study
71 Business Transit Corridor Study
implementing a similar service?
71 Business Transit Corridor Study
34
71 Business Transit Corridor Study
35
71 Business Transit Corridor Study Peak Headways 15 Minute 12.5 Minute 10 Minute Annual Operating Costs $2.47 Million $2.83 Million $3.57 Million
71 Business Transit Corridor Study
71 Business Transit Corridor Study