The Five Cs of Climate the future. Change November 14, 2013 - - PDF document

the five c s of climate
SMART_READER_LITE
LIVE PREVIEW

The Five Cs of Climate the future. Change November 14, 2013 - - PDF document

11/13/2013 Current day climate change is being caused by humans. Therefore, the choices we make in response to it will determine The Five Cs of Climate the future. Change November 14, 2013 Choices Leslie Grady Jr., Ph.D. Climate Action


slide-1
SLIDE 1

11/13/2013 1

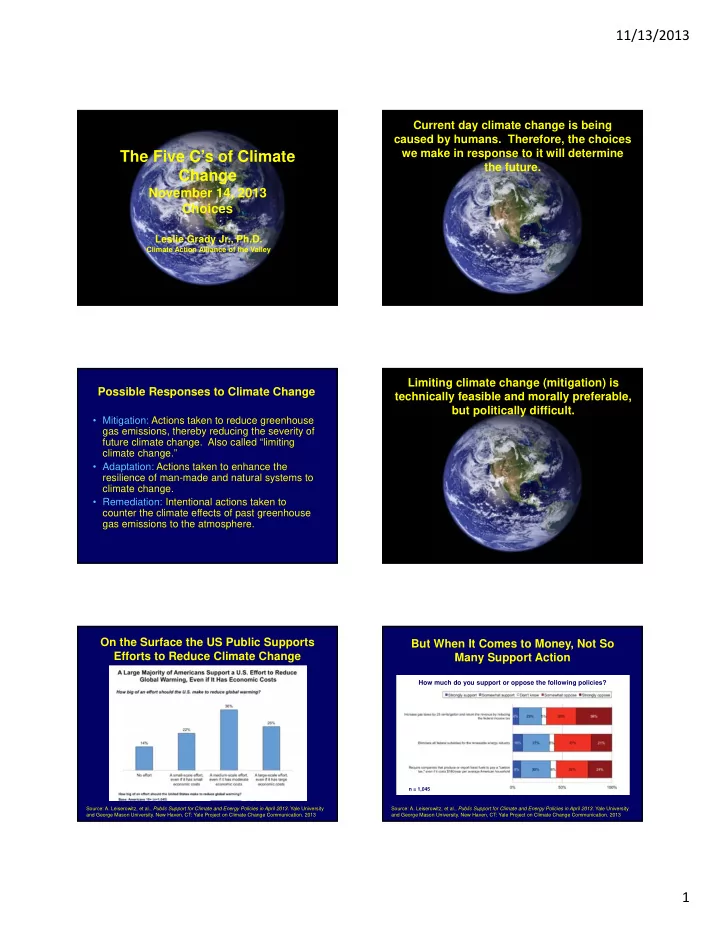
The Five C’s of Climate Change

November 14, 2013 Choices

Leslie Grady Jr., Ph.D.

Climate Action Alliance of the Valley

Current day climate change is being caused by humans. Therefore, the choices we make in response to it will determine the future.

  • Mitigation: Actions taken to reduce greenhouse

gas emissions, thereby reducing the severity of future climate change. Also called “limiting climate change.”

  • Adaptation: Actions taken to enhance the

resilience of man-made and natural systems to climate change.

  • Remediation: Intentional actions taken to

counter the climate effects of past greenhouse gas emissions to the atmosphere.

Possible Responses to Climate Change Limiting climate change (mitigation) is technically feasible and morally preferable, but politically difficult. On the Surface the US Public Supports Efforts to Reduce Climate Change

Source: A. Leiserowitz, et al., Public Support for Climate and Energy Policies in April 2013. Yale University and George Mason University. New Haven, CT: Yale Project on Climate Change Communication. 2013

But When It Comes to Money, Not So Many Support Action

Source: A. Leiserowitz, et al., Public Support for Climate and Energy Policies in April 2013. Yale University and George Mason University. New Haven, CT: Yale Project on Climate Change Communication. 2013

How much do you support or oppose the following policies?

n = 1,045

slide-2
SLIDE 2

11/13/2013 2

Although limitations on global CO2 emissions are needed, reaching agreement

  • n emission limits is difficult.

To Keep the Temperature Increase below 2°C, Emissions Must Be Limited

Figure adapted from TFE.8, Figure 1, Technical Summary of Working Group I Contribution to the IPCC Fifth Assessment Report; Climate Change 2013: The Physical Science Basis, Final Draft Approved Sept. 26, 2013 in Stockholm, Sweden

The problem: More than half of the global carbon budget has already been used.

1 Pg C = 1,000,000,000,000,000 g C = 1 Gt C = 3.67 Gt CO2 2012 Emission Rate = 9.5 Pg C/yr = 38 Gt CO2/yr

Target Temp. Increase Carbon Budget

Past CO2 Emissions Have Committed Earth to Warming beyond that Seen to Date

Source: B. Hare and M. Meinhausen, How Much Warming Are we Committed to and How Much Can Be Avoided, Climatic Change, 75, 111, 2006.

  • Who is responsible?
  • Should that responsibility be reflected in future emission allocations?

Global Carbon Emissions

2010 Annual Emissions 1751-2010 Cumulative Emissions

From J. Hansen, “A New Age of Risk”, Seminar presented at the Low Memorial Library, Columbia University, September 22, 2012, http://www.columbia.edu/~jeh1/

How are past carbon emissions and current emissions balanced in deciding on allocation of the global carbon budget?

People in the USA Use a Large Amount of Energy and Emit a Lot of Carbon

Figure from http://what-when-how.com/wp-content/uploads/2011/05/tmpE45_thumb.jpg

Does this mean that the United States must make significant changes in order to convince the rest of the world to change?

International Agreements Are Based on Carbon Intensity

Data from PricewaterhouseCoopers LLP, Too Late for Two Degrees, Low Carbon Economy Index 2012

100 200 300 400 500 600 700 800 900

Carbon Intensity for 2010-2011

ton CO2/Million $ GDP

Worldwide Average Carbon Intensity = 395

slide-3
SLIDE 3

11/13/2013 3

Reductions in Carbon Intensity Are Too Slow

Figure from PricewaterhouseCoopers LLP, Too Late for Two Degrees, Low Carbon Economy Index 2012

Some Countries Are Doing Better than Others

Data from PricewaterhouseCoopers LLP, Too Late for Two Degrees, Low Carbon Economy Index 2012

  • 8.0
  • 6.0
  • 4.0
  • 2.0

0.0 2.0 4.0 6.0 8.0

Percent Change in Carbon Intensity

2010-2011

How do we obtain our energy, what do we use it for, and how might we reduce our CO2 emissions without damaging the economy? Reduction of CO2 Emissions Can Be Accomplished by Combining Many Actions

  • S. Pacala and R. Socolow, Stabilization Wedges: Solving the Climate Problem for the Next 50 Years with

Current Technologies, Science, 305 (5686), 968-972, 2004. Image from http://www.clv101.plus.com/vt/cv_socolow_wedge1000.gif

Delivery of Energy (in Quads) in the United States in 2007

Figure from Overview and Summary of America's Energy Future: Technology and Transformation, The National Academy of Sciences, Washington, DC, 2010

A Quad is a quadrillion BTU = 1015 BTU. Total = 101.51 Quads

Distribution of US Energy Sources

2008 Total = 101.6 Quads Left figure from Overview and Summary of America's Energy Future: Technology and Transformation, The National Academy of Sciences, Washington, DC, 2010 Right figure from http://en.wikipedia.org/wiki/File:US_Renewable_Electricity_by_Source.png. Data from US Energy Information Agency. 2012 Renewable Electricity Generation

slide-4
SLIDE 4

11/13/2013 4

Changing America’s Energy System Will Be Very Difficult

  • The National Academy of Sciences conducted a large study on

“America’s Energy Future”.

– The full report was published in 2009 and a summary was published in 2010. It preceded the boom in natural gas extraction. – They are available free in pdf format from the National Academies Press (www.nap.edu).

  • The reports note several barriers to achieving needed change.

Among them:

– “The United States has never adopted a comprehensive national energy policy to meet goals for sustainability, economic prosperity, security, and environmental quality.” – The “complex mix of scientific, technical, economic, social, and political elements” of our energy system “means that transformational change will be an immense undertaking, requiring decades to complete.”

  • The reports emphasize the need to begin now to set the

foundation for our energy future.

America’s Potential for Increasing Energy Efficiency Is Enormous

  • Could lower energy consumption by about 15% by 2020 and

an additional 15% by 2030.

  • Such savings could more than offset the EIA’s projected

increases in U.S. energy consumption through 2030.

  • Buildings Sector

– Energy savings of 25–30%, relative to the EIA reference case, could be achieved over the next 20–25 years. – More-efficient technologies for space heating and cooling, water heating, lighting, and electronics would provide most of this reduction.

  • The most efficient lights and electronics are those that are turned off

when not needed. Automated system offer huge savings.

– For the entire buildings sector, a cumulative investment of $440 billion in existing technology between 2010 and 2030 could produce an annual savings of $170 billion in reduced energy costs. – Technologies under development promise even greater gains.

America’s Potential for Increasing Energy Efficiency Is Enormous - II

  • Transportation sector

– Responsible for almost one third of US greenhouse gas emissions. – Cars and light trucks

  • The fuel economy standard for cars was 25 mpg until 2012.
  • In 2012 a new CAFE standard went into effect that will

increase the standard to 39 mpg for cars and 30 mpg for light trucks by 2016.

  • In 2017 another new CAFE standard will take effect that will

require better and better fuel economy until 2025.

  • Both standards are shown on the next slide.
  • These standards will be met by a combination of factors

and will result in a different mix of vehicles on the road.

CAFE Standards Are Aimed at Reducing Fuel Consumption by Cars and Light Trucks

Figure from http://en.wikipedia.org/wiki/File:CAFE_Fuel_Economy_vs_Model_Year_and_Footprint_with_2017-2022_Proposals.png Figure generated by James Adcock from EPA formula.

America’s Potential for Increasing Energy Efficiency Is Enormous - III

  • Transportation sector (continued)

– Medium and heavy duty trucks

  • Hybrid diesel-electric power trains with continuously

variable transmissions and lower aerodynamic drag

  • ffer great promise for better fuel economy.
  • Shifting long-distance freight from trucks to rail can
  • ffer considerable energy savings, because rail is about

10 times more energy-efficient than trucks.

– Air transportation

  • While the newest airplanes are more fuel efficient, their

use will do little more than offset the growth in air travel.

America’s Potential for Increasing Energy Efficiency Is Enormous - IV

  • Industrial sector

– Can cost-effectively reduce fuel use by 14–22% by 2020. – Most improvements can be achieved in energy-intensive industries such as chemicals, petroleum, pulp and paper, iron and steel, and cement manufacturing.

  • Barriers to deployment of better technologies.

– Owners of buildings often do not pay for energy used, and thus have no incentive to build energy-efficient buildings. – Utilities give discounts for higher energy use. – The cautiousness of business owners.

slide-5
SLIDE 5

11/13/2013 5

Energy Supply Options for Reducing Greenhouse Gas Emissions

  • The size of the US energy sector is huge with large investments

in fossil fuel technologies.

  • Even if the will existed, decades would be required to replace the

existing infrastructure.

  • America’s Energy Future Committee projects that with a

sustained effort, non-hydroelectric renewables could provide 10%

  • f the nation’s electricity generation by 2020 and 20% or more by
  • 2035. With hydropower included, renewables could provide more

than 25% of the nation’s electricity by 2035.

  • Reinventing Fire, written by Amory Lovins and colleagues at the

Rocky Mountain Institute, is much more optimistic about the deployment of renewable energy.

– They state that 80% of electricity demand could be met by renewables in 2050, provided that the potential of energy efficiency is met. – The aging fossil fuel infrastructure is seen as an opportunity. – Would require major changes in distribution of electricity.

The Social Costs of Fossil Fuels Must Be Considered for a True Comparison

Source: M. Greenstone and A. Looney, A Strategy for America’s Energy Future: Illuminating Energy’s Full Costs, The Hamilton Project, Brookings, Washington, DC, May 2011.

The Aging Fleet of Coal-Fired Power Plants Provides an Opportunity

Source of figure: A. B. Lovins et al, Reinventing Fire: Bold Business Solutions for the New Energy Era, Chelsea Green Publishing, White River Junction, Vermont, 2011, Figure 5-6, p 175.

Energy Sources Must Be Combined to Use Renewable Energy

Source of figure: A. B. Lovins et al, Reinventing Fire: Bold Business Solutions for the New Energy Era, Chelsea Green Publishing, White River Junction, Vermont, 2011, Figure 5-19, p 198.

Carbon Social Costs Can Be Reduced by Using Carbon Capture and Storage (CCS)

From Congressional Research Service, Carbon Capture, A Technology Assessment, Nov. 5, 2013.

New Generation Nuclear Reactors Offer Electricity without CO2 Emissions

Source: http://en.wikipedia.org/wiki/Generation_IV_reactor. See Wikipedia for more information. Also see: http://www.world-nuclear.org/info/Nuclear-Fuel-Cycle/Power-Reactors/Advanced-Nuclear-Power- Reactors/

slide-6
SLIDE 6

11/13/2013 6

Putting a Price on Carbon Is Not Popular

Source: A. Leiserowitz, et al., Public Support for Climate and Energy Policies in April 2013. Yale University and George Mason University. New Haven, CT: Yale Project on Climate Change Communication. 2013

If we do not limit CO2 emissions, then we must adapt to the resulting climate change. Adaptation to Climate Change Is a Risk Management Strategy

  • Vulnerabilities to climate change impacts exist all

across America.

– They differ by region, sector, scale, and segment of society. – They interact with a region’s current vulnerabilities.

  • Even though future impacts are not known precisely,

adaptation offers a way to minimize the risks to the social, economic, and natural systems being impacted.

  • Adaptation planning and action will be required

across all levels of government, as well as within the private sector, NGOs, and community organizations.

Adaptation Has Limitations

  • Society’s ability to adapt to climate change decreases as

the severity increases.

– At moderate rates and levels of climate change, adaptation can do a great deal. – At severe rates and levels of climate change, the limits of many adaptation options might be reached.

  • Resulting adaptations are likely to be much more disruptive and

costly.

  • Adaptation is not an alternative to mitigation.

– It is simply a way to cope with prior failure.

  • Options for adaptation lack solid information about

benefits, costs, potentials, and limits for three reasons:

– an inability to attribute many observed changes at local and regional scales to climate change, – the diversity of impacts and vulnerabilities across the US, – the relatively small body of research on climate change adaptation.

Planning Process for Adaptation

Figure from Adapting to the Impacts of Climate Change, National Research Council, National Academy of Sciences, 2010. Available at http://www.nap.edu/catalog.php?record_id=12783

Principles to Guide Climate Change Adaptation

  • In making adaptation decisions, focus not only on
  • ptimizing conditions for the current generation, but

also look several generations ahead and consider ways to reduce risk over time.

  • Account for the impacts of adaptation decisions on

natural and social systems as well as on individuals, firms, government institutions, and infrastructure.

  • Recognize that ecosystem structure and functioning

are particularly vulnerable to climate change and need consideration in adaptation decisions.

  • Evaluate solutions from a perspective of sustainability

so that social, economic, and environmental ramifications of proposed strategies and actions are explicitly recognized.

From Adapting to the Impacts of Climate Change, National Research Council, National Academy of Sciences, 2010. Available at http://www.nap.edu/catalog.php?record_id=12783

slide-7
SLIDE 7

11/13/2013 7

Principles to Guide Climate Change Adaptation - II

  • Acknowledge equity and justice in adaptation decisions;

there is a need to prioritize helping those with a higher degree of vulnerability to become more resilient.

  • There is a need to identify the potential impacts of

proposed adaptation options on all affected parties.

  • Develop a portfolio approach for addressing adaptation

problems, including a suite of technology and social- behavioral-economic options.

  • Develop methods of evaluation so that the risk of inactions

can be compared with the risk of proposed actions.

  • Recognize the international implications of U.S. adaptation

and emissions-reduction efforts, as well as the impacts on the United States of decisions made by other countries.

From Adapting to the Impacts of Climate Change, National Research Council, National Academy of Sciences, 2010. Available at http://www.nap.edu/catalog.php?record_id=12783

Summary of Regional Climate-Related Impacts

From Adapting to the Impacts of Climate Change, National Research Council, National Academy of Sciences, 2010. Available at http://www.nap.edu/catalog.php?record_id=12783

Impacts of Climate Change on the Coastal Sector that May Require Adaptation

Aspect of Climate Change Impact Accelerated sea level rise and lake level changes Gradual inundation of low-lying land Loss of coastal habitats, especially coastal wetlands Saltwater intrusion into coastal aquifers and rivers Increased shoreline erosion and loss of barrier islands Changes in navigational conditions Changes in sea ice Changes in ecosystem structures Exacerbate coastal erosion Severe storms reach coast Increased intensity and frequency of coastal storms Increased storm surge and flooding Increased wind damage Sudden coastal/shoreline alterations Changes in physical and chemical characteristics of marine systems Changes in salinity; Changes in circulation; Changes in seawater temperature Changes in salinity and temperature stratification Changes in estuarine structure and processes (e.g., salt wedge migration); Changes in ecosystem structure (“invasive,” nonnative species), species distributions, population genetics, and life history strategies (including migratory routes for protected and commercially important species) Increased frequency and extent of harmful algal blooms and coastal hypoxia events Changes in precipitation Increased runoff and non-point source pollution or eutrophication Changes in coastal hydrology and related ecosystem impacts Increased coastal flooding

Adapted from Adapting to the Impacts of Climate Change, National Research Council, National Academy of Sciences, 2010. Available at http://www.nap.edu/catalog.php?record_id=12783

Examples of Climate Change Policies That Might Require an Adaptive Response

  • If climate change policies emphasize reductions in GHG

emissions, then regional economies dependent on fossil fuel production and use will need to transition to different economic bases.

  • If climate change policies favor land-intensive renewable energy

alternatives, then land areas devoted to natural resource preservation, forestry, agriculture, and ranching may face challenges.

  • Proposed climate change policies may raise energy prices as

fossil fuel energy sources are replaced by lower-emitting but more expensive alternatives. This could affect energy intensive aspects of society, such as transportation and electricity supplies.

  • Climate change policies that alter the nation’s portfolio of energy

supply technologies will create economic winners and losers.

From Adapting to the Impacts of Climate Change, National Research Council, National Academy of Sciences, 2010. Available at http://www.nap.edu/catalog.php?record_id=12783

Some advocate taking intentional action (remediation) to counter the effects of past greenhouse gas emissions. Climate Remediation Strategies Include CO2 Removal and Solar Radiation Management

From, Geoengineering: A National Strategic Plan for Research on the Potential Effectiveness, Feasibility, and Consequences of Climate Remediation Technologies, The Bipartisan Policy Center, Washington, DC, 2011. http://bipartisanpolicy.org/library/report/task-force-climate-remediation-research

slide-8
SLIDE 8

11/13/2013 8

CO2 Removal

  • Low Risk Techniques

– Store carbon biologically by planting trees and other vegetation. – Produce biochar and apply to soil. – Employ technologies similar conceptually to those used for carbon capture and storage. – Enhance natural chemical processes, such as terrestrial and oceanic rock weathering, to enable more CO2 to react chemically with rock minerals.

  • High Risk Techniques

– Fertilize the oceans with iron or other nutrients to stimulate growth of phytoplankton, accelerating a part of the carbon cycle. – An experiment undertaken by an individual last year resulted in a ban on this practice without approval from an international body.

Solar Radiation Management

  • Solar radiation management is inherently risky because the

global impacts are relatively unknown.

– Has strong moral and political ramifications.

  • Because the underlying cause of climate change has not

been altered, once begun, solar radiation management would have to be continued indefinitely.

– Once stopped, temperature would rise rapidly in response to the CO2 level in the atmosphere.

  • Most interest is focused on two distinct concepts.

– Introducing very fine particles or liquid droplets (known as aerosols) into the stratosphere to deflect incoming solar radiation. – Altering the reflectivity of clouds by means such as spraying droplets of seawater into the atmosphere to make cloud droplets more numerous and smaller

  • Considered mainly as an emergency procedure in case a

tipping point was reached.