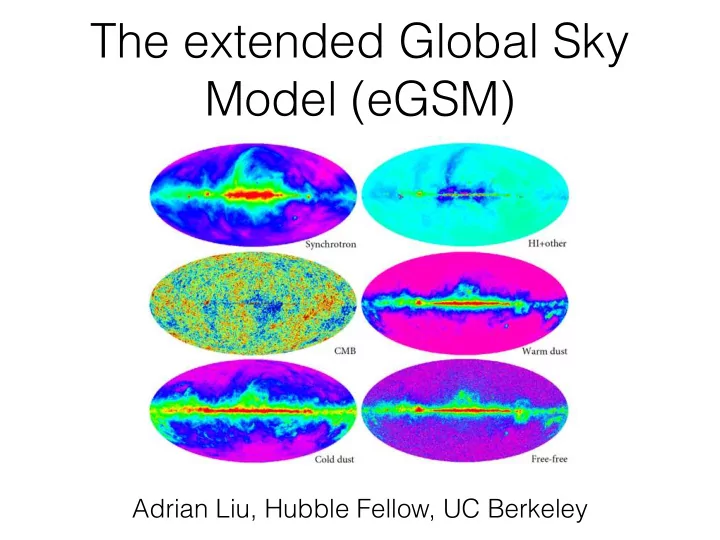
SLIDE 1 The extended Global Sky Model (eGSM)
Adrian Liu, Hubble Fellow, UC Berkeley
SLIDE 2
The extended Global Sky Model (eGSM) project
Adrian Liu, UC Berkeley Aaron Parsons, UC Berkeley Doyeon “Avery” Kim, UC Berkeley Josh Dillon, UC Berkeley Eric Switzer, NASA Goddard Max Tegmark, MIT Haoxuan “Jeff” Zheng, MIT/Intel
SLIDE 3 What does the sky look like in all directions at “all” frequencies?
10 MHz 408 MHz 85 MHz
??? ???
SLIDE 4
How does one model the sky?
SLIDE 5 Global Sky Model v1
(de Oliveira-Costa et al. 2008, MNRAS 388, 247)
SLIDE 6
Take a wide selection of survey data…
SLIDE 7
…identify common regions…
SLIDE 8
…which are then used to train three principal component spectral templates…
SLIDE 9
…that are used to fit the spectra in every pixel of the sky…
SLIDE 10
…and are interpolated to produces maps of the sky at “any” frequency
SLIDE 11 Global Sky Model v2
(Zheng… AL… et al. 2017, MNRAS 464, 3486)
SLIDE 12 Take an even wider selection
SLIDE 13
…simultaneously fit for spectral and spatial information across the whole sky, even when there is missing data…
SLIDE 14
…now using six spectral components…
SLIDE 15
…to derive even higher quality maps.
SLIDE 16
…to derive even higher quality maps.
By design, the eGSM does not explicitly model physical components
SLIDE 17
The principal components are not physical foreground components
SLIDE 18
Physical components can be identified by taking linear combinations that dominate at various frequencies
SLIDE 19
Blindly separated physical component maps from the eGSM
SLIDE 20
Favorable comparison to Planck data
SLIDE 21
Favorable comparison to Planck data
SLIDE 22
Blindly separated physical component maps from the eGSM
SLIDE 23 Global Sky Model v3
(Kim, AL… et al. 2017, in prep.)
SLIDE 24
Why three components? Why six components?
SLIDE 25 Why three components? Why six components?
Too few components: inadequate fits to data Too many components: overfitting of data
SLIDE 26
Computing the Bayesian Evidence provides a way to determine the optimal number of principal components to fit
SLIDE 27 Computing the Bayesian Evidence provides a way to determine the optimal number of principal components to fit
Image credit: Zoubin Ghahramani
SLIDE 28 Computing the Bayesian Evidence provides a way to determine the optimal number of principal components to fit
Maximum likelihood Image credit: Zoubin Ghahramani
SLIDE 29 Computing the Bayesian Evidence provides a way to determine the optimal number of principal components to fit
Maximum likelihood Image credit: Zoubin Ghahramani
SLIDE 30 Computing the Bayesian Evidence provides a way to determine the optimal number of principal components to fit
Maximum likelihood Greatest evidence Image credit: Zoubin Ghahramani
SLIDE 31 Optimal number of principal components
2 13
SLIDE 32 Lots more coming soon to a Github repo near you!
Already in progress
- Position-dependent number of components.
- Error bars in output maps.
- Framework for incorporating global signal
measurements. Commencing 2017
- Polarization maps (Switzer).
- Inclusion of new global signal + map data.