
SLIDE 1
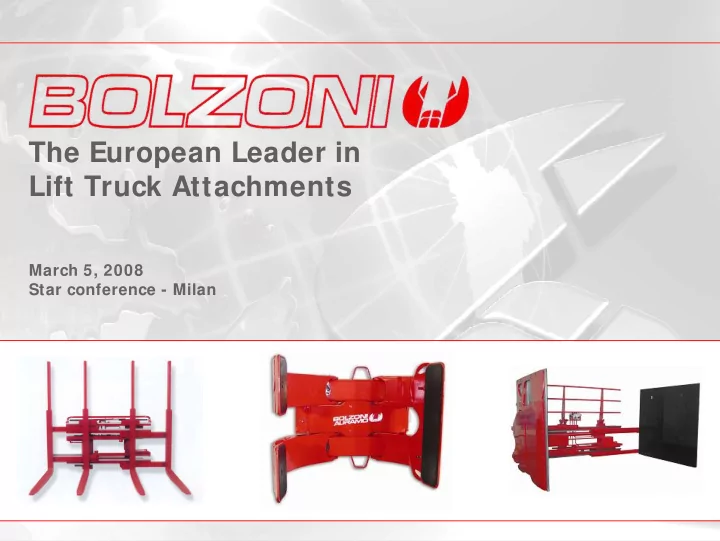
The European Leader in Lift Truck Attachments March 5, 2008 Star - - PowerPoint PPT Presentation
The European Leader in Lift Truck Attachments March 5, 2008 Star conference - Milan Bolzoni at a glance Growth is ahead of us Logistics (2004-08E CAGR: 6.4% ) Material Handling Components Lift Truck (* ) Attachments & Lift Tables
– 3 –
Lift Truck Manufacturers (OEM) Dealers of Lift Trucks & Material Handling Components End users (Logistics, I ndustrial, Large Retail companies) Logistics (2004-’08E CAGR: 6.4% ) Material Handling Components Lift Truck(* ) Attachments & Lift Tables Manufacturers
(* ) Defined as “Counterbalanced Lift Trucks”
– 4 –
Lift Truck Attachments
PRODUCTS STRATEGI C BUSI NESS UNI T
Material Handling Components
2007 Net Sales €145,6m (* ) (% ) 125,1M€ (86% ) 10,5M€ (7% ) 3,5M€ (2% )
1 Lift Tables 2 Hand Pallet Trucks 3
(* ) Includes € 5,6m (4%) of Other Revenues (Rental business and Customer care)
PHASE OUT in 2008
Forks 4
0,9M€ (1% ) START UP in 2007
– 5 –
I ntelligent Paper Clamp Multipallet Clamp I ntelligent Carton Clamp
– 6 –
(1) Includes (for 10 months) the acquisition of the Finnish company Auramo OY, a leading manufacturer of Lift Truck attachments (pulp & paper clamps) (2) Includes acquisition of Brudi (3) Sale of masts activity (4) Includes 2 months (4.8 Euro mln) of Meyer Group
Net sales (€m)
Auramo acquisition I PO and Meyer acquisition Brudi acquisition
CAGR 1997-2007: 16,1%
32,7 37,4 41,8 53,2 76,2 78,9 75,1 84 94,7 107,1
(1) (2) (3) (4)
145,6
1997 2003 2004 2005 2006 2007 1999 2000 2001 2002 1998
– 7 –
2003 2004
Joint Venture Agreement with Tiger Technology (H.K.) and opening of a commercial/ production site in China
Acquisition of the Finnish Auramo OY (a leader in Europe in fork Lift Truck Attachments for pulp and paper industry) Acquisition of “Brudi” business unit (& trademark) in USA
2001
Banca I ntesa acquires/ subscribes 30% of share capital
1945
Brothers Livio and Luigi Bolzoni start production of mechanical equipment for agricultural purposes
1991
Acquisition of Elman (Spanish manufacturer of Lift Truck Attachments)
1987
I ncorporation of Teko (manufacturer of Hand pallet trucks and Lift tables founded by Roberto Scotti) Opening of a new commercial Subsidiary in UK
1989
Opening of a new commercial subsidiary in USA (Chicago) Start of production activity in 1990
2002
Sale of masts activity (non- core business)
2006
Approval of listing process at Borsa I taliana (STAR segment)
A new stage for organic and external growth Acquisition of the German Hans H. Meyer GMBH, leader in Europe in Fork Lift Truck Attachments
2007
Start-up of the new business: forks
– 9 –
Europe with about 40% market share
the World with about 25% market share
about 81% market share
Lift Truck Attachments in Europe (Mkt share % ) Lift Truck Attachments worldwide (Mkt share % ) I ntegral Sideshifters worldwide (Mkt share% )
Bolzoni 81,0% Others 19,0% Bolzoni-Meyer 40,00% Kaup 25,50% Others 6,20% Cascade 28,30% Cascade 50,70% Bolzoni-Meyer 25,30% Kaup 14,70% Others 9,30%
– 10 –
Breakdown of Bolzoni revenues by segment (2007) Lift truck manufacturers: Market Share % Bolzoni’s Customers (* )
(ca.28% of total revenues in 2007) with a high retention rate (more than 7 years for most of them)
market, controlling about 22% of the market
revenues in 2007): well-diversified portfolio of
OEM 28,1% Dealers 71,9% Ot hers 29% Crown 6% Nissan 4% Nacco 10% Linde 15% Jungheinrich 8% Mit subishi 6% Toyot a 22%
Company Years with Bolzoni
Linde > 10 Nacco M.H. S.p.A. > 10 Jungheinrich AG / GmbH > 10 Toyota Ind. Equipment 9 Nacco M.H. USA 8 OM Carrelli Elevatori 8 Mitsubishi 6
– 11 –
with direct presence)
with a network of 11 independent distributors
party manufacturers in Europe, USA and potentially in Far East
Source: Bolzoni - Marketing Dept.
Indipendent distributor Associated company Commercial subsidiary Production sites Exclusive Distributors Meyer Group
– 13 –
Consolidation in Europe and penetration in new growing markets Launch of new products/ services Process innovation to increase profitability 1 2 3 Opportunities for external growth 4
– 14 –
Net Sales – Geographic breakdown (2007 – 2008E – 2009E; €/ Mln)
2 0 0 7 2 0 0 8 2 0 0 9
155.000
158.000 172.000 169.000
are: increasing market share, fork business, exploiting Meyer commercial synergies
– 15 –
Our growth is forecasted at + 62,4% (CAGR) from 2007 to 2010 and the main drivers are:
CAGR 2007-2010: 62,4%
(1)
3 €M 7 €M 15 €M 10 €M
2007 2008 2009 2010
O thers 70,0% B
30,0%
Fork Market in Europe in 2010 (Mkt share % )
– 16 –
Synergies have been evaluated in the following areas:
(1) Bain and Company Management estimations
Capex and one/ off costs 900 600
800 - 900 1.800 - 2.500 100 - 200 200 - 300 500 1000 1500 2000 2500 3000 2007 2008 2009
Sales Synergies Cost synergies 900 – 1.100 (1) 2.000 – 2.800 (1)
Thousands of Euro
– 17 –
Recent acquisition
manufacturer Our successful acquisitions
Lift Truck Attachments)
leader in Europe in fork Lift Truck Attachments for pulp and paper industry)
trademark) in USA Other potential acquisition targets
– 19 –
Net Sales – Geographic breakdown (4th quarter 2006 – 4th quarter 2007; €/ Mln)
INCREASE:
13,1%
+ 22,4%
26.080 31.910 3.362 2.015 2.865 2.625 4th quarter 2006 4th quarter 2007
E UROP A NORTH A ME RIC A RE S T OF THE W ORLD
– 20 –
Net Sales – Geographic breakdown (31 Dec 2006 – 31 Dec 2007; €/ Mln)
INCREASE:
36,0% + 58,3%
+ 44,1%
83.505 120.308 15.427 12.399 8.171 12.931
31 dec 2006 31 dec 2007
EUROPA NORTH AMERICA REST OF THE WORLD
– 21 –
4 t h quart er 2 0 0 6 4 t h quart er 2 0 0 7 2 0 0 7 vs 2 0 0 6 Thousa nds of Euro
Turnover 32.307
1 0 0 ,0 %
36.550
1 0 0 ,0 %
13,1% Other operating revenue 683
2 ,1 %
511
1 ,4 %
Tot al revenue 3 2 .9 9 0
1 0 2 ,1 %
3 7 .0 6 1
1 0 1 ,4 %
12,3% Costs for raw m aterial and consum ables (13.536)
(14.537)
7,4% Costs for services (7.922)
(9.210)
16,3% Personnel expenses (8.056)
(8.602)
6,8% Other operating expenses (99)
(459)
363,6% Result of associated com panies at Net Equity 68
0 ,2 %
33
0 ,1 %
Gross Opera t ing Result ( EBI TD A) 3 .4 4 5
1 0 ,7 %
4 .2 8 6
1 1 ,7 %
24,4% Depreciation & Am ortisation (1.009)
(1.397)
38,5% Provisions and w rite-dow ns (64)
(153)
139,1%
Operat ing result 2 .3 7 2
7 ,3 %
2 .7 3 6
7 ,5 %
15,3% Financial incom e and expenses (309)
(674)
118,1% Exchange rate earnings and losses (270)
(441)
63,3%
Result before t a x 1 .7 9 3
5 ,5 %
1 .6 2 1
4 ,4 %
– 22 –
3 1 Dec 2 0 0 6 3 1 Dec 2 0 0 7 2 0 0 7 vs 2 0 0 6 Thousands of Euro
Turnover 107.103
1 0 0 ,0 %
145.638
1 0 0 ,0 %
36,0% Other operating revenue 1.184
1 ,1 %
2.133
1 ,5 %
80,2%
Total revenue 1 0 8 .2 8 7
1 0 1 ,1 %
1 4 7 .7 7 1
1 0 1 ,5 %
36,5% Costs for raw m aterial and consum ables (42.043)
(57.755)
37,4% Costs for services (26.977)
(34.756)
28,8% Personnel expenses (25.780)
(36.451)
41,4% Other operating expenses (403)
(1.092)
171,0% Result of associated com panies at Net Equity 156
0 ,1 %
122
0 ,1 %
Gross Operating Result ( EBI TDA) 1 3 .2 4 0
1 2 ,4 %
1 7 .8 3 9
1 2 ,2 %
34,7% Depreciation & Am ortisation (3.384)
(4.890)
44,5% Provisions and w rite-dow ns (188)
(378)
101,1%
Operating result 9 .6 6 8
9 ,0 %
1 2 .5 7 1
8 ,6 %
30,0% Financial incom e and expenses (737)
(1.713)
132,4% Exchange rate earnings and losses (782)
(816)
4,3%
Result before tax 8 .1 4 9
7 ,6 %
1 0 .0 4 2
6 ,9 %
23,2%
– 23 –
The negative balance of the net financial position has been increased from 18,3 million Euro at 31.12.2006 to 25,9 million Euro at the end of December 2007. This increase is to support the growth of the business. Thousands of Euro
31.12.2006 31.12.2007
Cash and cash equivalent 4.473 3.061 Current portion of long term debts (15.313) (14.367)
Net financial position - short term ( 10.840) ( 11.306)
Financial assets held to maturity 1.425 60 Non current portion of long term debts (8.917) (14.690)
Net financial position - M/ L term ( 7.492) ( 14.630) Net financial position ( 18.332) ( 25.936)
– 25 –
3 ,3 9 % 4 ,9 4 % 2 ,0 0 % 5 0 ,4 0 % 3 ,1 4 % 3 ,5 8 % 3 2 ,5 5 %
Pent a Holding ( * ) Tamburi I nv. Ma rket Banca I nt esa K.P. St aa ck Object if Small Caps Euro ( Lazard) Fidelit y I nt ernat ional Shareholders at 13/02/2008 (%)
(*) Shareholders are: Emilio Bolzoni, Franco Bolzoni, PierLuigi Magnelli, Luigi Pisani, Roberto Scotti
with a variation from 1st January 2008 by -18,41%; the maximum share price has been € 5,88 (on 23rd Apr 2007), the minimum € 2,9375 (on 28th January 2008).
– 27 –
World; worldwide leader in Integral Sideshifters
– 29 –
and our consolidated relations with a network of independent distributors
third party manufacturers in Europe, USA and potentially in Far East
BOLZONI S.P.A. Headquarter I taly
BOLZONI AURAMO Gmbh Germany 100% BOLZONI AURAMO AB Sweden 100% BOLZONI AURAMO Ltd UK 100% BOLZONI AURAMO Sarl France 100% BOLZONI AURAMO BV Benelux 51% BOLZONI AURAMO SL Spain 100% BOLZONI AURAMO Srl South I taly 100% BOLZONI AURAMO Z.O.O. Polska 60% AURAMO OY Finland 100% AURAMO BALTI C OU Estonia 100% AURAMO ZA South Africa 40% BOLZONI AURAMO Ltd Canada 100% BOLZONI AURAMO I nc USA 100% BOLZONI AURAMO Sa Chile 100% BOLZONI AURAMO Pty Australia 100% EUROLI FT Pty Australia 24% BOLZONI AURAMO Shanghai China 60% HANS H. MEYER Gmbh Germany 100% MEYER Sarl France 100% HANS H. MEYER Ltd UK 100% MEYER SCANDI NAVI A AB Sweden 60% MEYER Srl I taly 30%
– 30 –
sites; no significant investment planned
Piacenza (I taly)
Products: Integral Sideshifters, Attachments, Lift Tables, Hand Pallet Trucks
Shanghai (China)
Products: Sideshifters
Chicago (I llinois) US
Products: Sideshifters, Push-Pulls
Helsinki (Finland)
Products: Paper Clamps
Barcellona
Products: Hook-on Sideshifters, Frames
Tallin (Estonia)
Products: Components
Salzgitter (Germany)
Products: Multipallets, Paper Clamps