
SLIDE 1
The$Davis$Philosophy Projections:$Residence$vs.$Actual$Enrollment - - PowerPoint PPT Presentation
The$Davis$Philosophy Projections:$Residence$vs.$Actual$Enrollment Facilities$should$be$located$where$the$students$live Reasoning: Reduced$District$transportation$cost Increased$$ability$to$conduct$long$term$facility$planning
2
The$Davis$Philosophy
Projections:$Residence$vs.$Actual$Enrollment
14
Student$Capture$Rate$Analysis
Comparing$Estimated$City$School$Age$Population$to$Resident$D.U.S.D.$Students
Only$the$portion$of$South$Monrovia$Island$within$the$D.U.S.D.$boundaries$is$included$in$the$study
13
Student$Capture$Rate$Analysis
Comparing$Estimated$City$School$Age$Population$to$Resident$D.U.S.D.$Students
1D Estimated$school$age$population$is$from$ESRI$Business$Analyst$Online The$estimated$school$age$population$is$based$on$residence$regardless$of$where$they$attend$school 2$– Enrolled$in$D.U.S.D.$excludes$students$residing$outside$of$the$district$boundaries Only$the$portion$of$South$Monrovia$Island$within$the$D.U.S.D.$boundaries$is$included$in$the$study
6
Forecast$Factors$D Mobility
Measures the migration of students in and out of the district. Including move ins, move outs, new students from infill housing, drop outs, private school movement, etc.…
Areas$with$a$mobility$$above$ 1.000$are$experiencing$a$ positive$$migration$pattern
10
DistrictDwide$Projection$Chart
16
Student$Capture$Rate$Analysis
Comparing$Total$D.U.S.D.$Enrollment$and$Capture$Rate$to$Area$Districts
The$estimated$enrollment$is$based$on$enrolled$students$regardless$of$where$they$reside DUARTE 71.8%
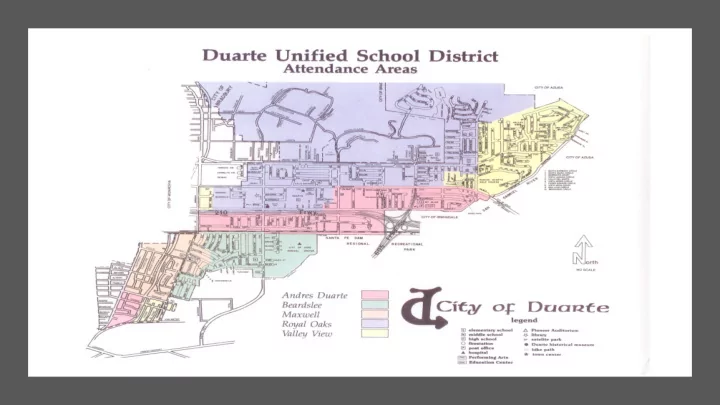
Andres Duarte ES Maxwell ES Valley View ES
Andres Duarte ES Beardslee ES Maxwell ES Royal Oaks ES Valley View ES E.S. Attendance Areas±
0.08 0.04 MilesTK-6 Students by School of Enrollment Non-Contiguous Areas Andres Duarte ES
School of Attendance Andres Duarte ES - 14 Beardless ES - 12 Maxwell ES - 16 Royal Oakls ES -5 Valley View ES - 27 Includes SDC Students Andres Duarte ES Beardslee ES Maxwell ES Valley View ES
Andres Duarte ES Beardslee ES Maxwell ES Royal Oaks ES Valley View ES E.S. Attendance Areas±
0.06 0.03 MilesTK-6 Students by School of Enrollment Non-Contiguous Areas Valley View ES South
School of Attendance Andres Duarte ES - 4 Beardless ES - 5 Maxwell ES - 17 Royal Oakls ES -3 Valley View ES - 43 Includes SDC Students Andres Duarte ES Royal Oaks ES Valley View ES
Andres Duarte ES Beardslee ES Maxwell ES Royal Oaks ES Valley View ES E.S. Attendance Areas±
0.05 0.025 MilesTK-6 Students by School of Enrollment Non-Contiguous Areas Valley View ES North
School of Attendance Andres Duarte ES - 3 Beardless ES - 2 Maxwell ES - 1 Royal Oakls ES - 12 Valley View ES - 10 Includes SDC Students O.D. AD BD MX RO VV Total BUS TK 2 3 2 3 4 5 19 4 K 6 3 1 11 6 24 51 6 1 7 4 2 15 7 26 61 10 2 3 4 2 16 10 28 63 16 3 3 6 3 11 5 18 46 8 4 2 6 1 9 7 25 50 4 5 6 4 11 8 29 58 5 6 2 4 1 14 3 22 46 9 Total 31 34 12 90 50 177 394 62
¹ º ¹ º ¹ º ¹ º ¹ º
Andres Duarte ES Beardslee ES Maxwell ES Royal Oaks ES Valley View ES
Miles
Andres Duarte ES Beardslee ES Maxwell ES Royal Oaks ES Valley View ES
¹ º ¹ º ¹ º ¹ º ¹ º
Andres Duarte ES Beardslee ES Maxwell ES Royal Oaks ES Valley View ES
Miles
ANDRES DUARTE ES BEARDSLEE ES MAXWELL ES ROYAL OAKS ES VALLEY VIEW ES Current Boundaries
! SCHOOL& 2015+16&TK+8& 2018+19&TK+8& 2019+20&TK+8& & CURRENT& PROPOSED& CURRENT& PROPOSED& CURRENT& PROPOSED& AD& 482& 452& 472& 443& 471& 441& BD& 461& 461& 452& 452& 450& 450& MX& 482& 570& 472& 558& 471& 556& RO& 662& 651& 648& 638& 646& 636& VV& 391& 344& 383& 337& 382& 336& TOTAL& 2,478& 2,478& 2,427& 2,427& 2,419& 2,419&