
SLIDE 1
2,000 4,000 6,000 8,000 10,000 12,000 2000 1950 1900 1850
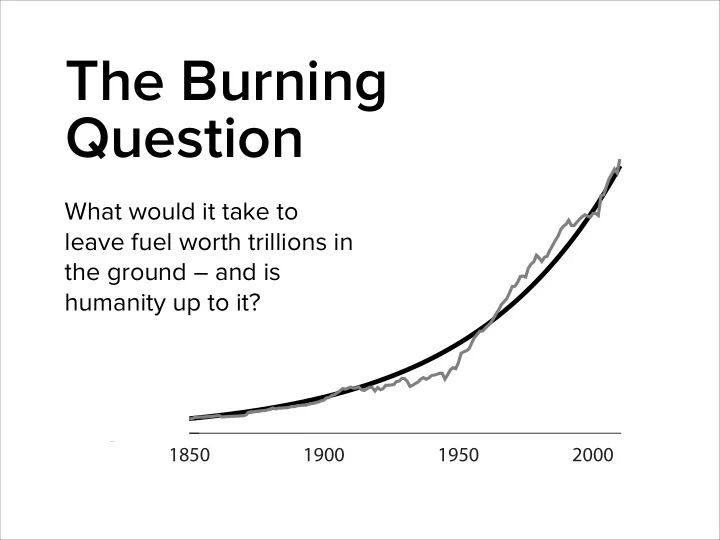
Global CO2 emissions (million tonnes carbon)
The Burning Question
What would it take to leave fuel worth trillions in the ground – and is humanity up to it?
The Burning Question Global CO 2 emissions (million tonnes carbon) - - PowerPoint PPT Presentation
The Burning Question Global CO 2 emissions (million tonnes carbon) 12,000 10,000 What would it take to 8,000 leave fuel worth trillions in the ground and is 6,000 humanity up to it? 4,000 2,000 0 1850 1900 1950 2000 About me
2,000 4,000 6,000 8,000 10,000 12,000 2000 1950 1900 1850
Global CO2 emissions (million tonnes carbon)
What would it take to leave fuel worth trillions in the ground – and is humanity up to it?
All charts and facts from The Burning Question by Duncan Clark and Mike Berners-Lee (Profile Books,2013)
All charts and facts from The Burning Question by Duncan Clark and Mike Berners-Lee (Profile Books,2013)
climate change?
don’t work?
to action?
All charts and facts from The Burning Question by Duncan Clark and Mike Berners-Lee (Profile Books,2013)
All charts and facts from The Burning Question by Duncan Clark and Mike Berners-Lee (Profile Books,2013)
All charts and facts from The Burning Question by Duncan Clark and Mike Berners-Lee (Profile Books,2013)
All charts and facts from The Burning Question by Duncan Clark and Mike Berners-Lee (Profile Books,2013)
All charts and facts from The Burning Question by Duncan Clark and Mike Berners-Lee (Profile Books,2013)
2,000 4,000 6,000 8,000 10,000 12,000 2000 1950 1900 1850
Global CO2 emissions (million tonnes carbon)
All charts and facts from The Burning Question by Duncan Clark and Mike Berners-Lee (Profile Books,2013)
2,000 4,000 6,000 8,000 10,000 12,000 2000 1950 1900 1850
Global CO2 emissions (million tonnes carbon)
All charts and facts from The Burning Question by Duncan Clark and Mike Berners-Lee (Profile Books,2013)
8,000 10,000 12,000 2010 2005 2000
Global CO2 emissions (million tonnes carbon)
All charts and facts from The Burning Question by Duncan Clark and Mike Berners-Lee (Profile Books,2013)
What if we stay on that curve?
All charts and facts from The Burning Question by Duncan Clark and Mike Berners-Lee (Profile Books,2013)
All charts and facts from The Burning Question by Duncan Clark and Mike Berners-Lee (Profile Books,2013)
All charts and facts from The Burning Question by Duncan Clark and Mike Berners-Lee (Profile Books,2013)
So instead we’re aiming for
All charts and facts from The Burning Question by Duncan Clark and Mike Berners-Lee (Profile Books,2013)
Risks to Many Risks to Unique and Threatened Systems Risks to Some Risk of Extreme Weather Events Large Increase Distribution
Negative for Most Regions Negative for Some Regions; Positive for Others Net Negative in All Metrics Aggregate Impacts Positive or Negative Market Impacts; Majority
Adversely Affected Risks of Large Scale Discontinuities High Low Updated Reasons For Concern 5 4 3 2 1
Future Past Increase in Global Mean Temperature above circa 1990 (°C) Risks to Many Risks to Unique and Threatened Systems Risks to Some Risk of Extreme Weather Events Large Increase Increase Distribution
Negative for Most Regions Negative for Some Regions; Positive for Others Net Negative in All Metrics Aggregate Impacts Positive or Negative Market Impacts; Majority
Adversely Affected Risks of Large Scale Discontinuities Higher Very Low TAR (2001) Reasons For Concern 5 4 3 2 1
Increase
…which is better but not “safe”
All charts and facts from The Burning Question by Duncan Clark and Mike Berners-Lee (Profile Books,2013)
The remaining budget
Double coin-fmip scenario (75% chance of success) Coin-fmip scenario (50% chance of success)
Emissions so far Future emissions
2000
billion tonnes of CO2
1600
billion tonnes of CO2
700
billion tonnes
All charts and facts from The Burning Question by Duncan Clark and Mike Berners-Lee (Profile Books,2013)
Total CO2 emissions since 1850
All charts and facts from The Burning Question by Duncan Clark and Mike Berners-Lee (Profile Books,2013)
The remaining budget
10000 2100 Today 1850 40 Billion tonnes of CO2
All charts and facts from The Burning Question by Duncan Clark and Mike Berners-Lee (Profile Books,2013)
The remaining budget
10000 2100 Today 1850 45 Billion tonnes of CO2
All charts and facts from The Burning Question by Duncan Clark and Mike Berners-Lee (Profile Books,2013)
Might we run out of fuel?
500 1000 1500 2000 2500 3000 Coal Gas Oil Remaining carbon budgets Proven reserves
Oil 630 Gas 430 Coal 2000 Coin-fmip 1600 Double coin-fmip 700
Billion tonnes of CO2
All charts and facts from The Burning Question by Duncan Clark and Mike Berners-Lee (Profile Books,2013)
Might we run out of fuel?
500 1000 1500 2000 2500 3000 3500 4000 10000 20000 30000 40000 50000
Billion tonnes of CO2
Oil Gas Oil
Gas
Coal (Coal) Fuel resources Coin-fmip budget Double coin-fmip Oil & gas resources Coin-fmip budget Double coin-fmip
All charts and facts from The Burning Question by Duncan Clark and Mike Berners-Lee (Profile Books,2013)
Are the global talks on track?
20 40 60 80 2050 2040 2030 2020 2010 2000 1990 Current pledges Needed for 2ºC Business as usual
Global greenhouse gas emissions (gigatonnes CO2e)
All charts and facts from The Burning Question by Duncan Clark and Mike Berners-Lee (Profile Books,2013)
All charts and facts from The Burning Question by Duncan Clark and Mike Berners-Lee (Profile Books,2013)
What drives the curve?
1 2 3 4 5 6 CO2 CO2 /Energy Energy / GDP GDP/Person Population 2010 2000 1990 1980 1970 1960 1950
I n d e x e d
All charts and facts from The Burning Question by Duncan Clark and Mike Berners-Lee (Profile Books,2013)
Population
1000 2000 3000 4000 5000 6000 7000 8000
Population
2010 2000 1990 1980 1970 1960 1950 1.0 1.5 2.0 2.5
Annual % increase
A n n u a l % c h a n g e G l
a l p
u l a t i
( m i l l i
s )
All charts and facts from The Burning Question by Duncan Clark and Mike Berners-Lee (Profile Books,2013)
Affluence (economic growth)
1000 2000 3000 4000 5000 6000 7000 8000
Affmuence
1 2 3 4 5 6
Annual change
2010 2000 1990 1980 1970 1960 1950
A n n u a l % c h a n g e A v e r a g e a ffm u e n c e (GDP / h e a d )
All charts and facts from The Burning Question by Duncan Clark and Mike Berners-Lee (Profile Books,2013)
Energy intensity (efficiency)
100 200 300 400 500
Energy intensity
2010 2000 1990 1980 1970 1960 1950
1 2 3
Annual change
Annual % change Energy intensity (Tonnes oil equivalent /GDP)
All charts and facts from The Burning Question by Duncan Clark and Mike Berners-Lee (Profile Books,2013)
Rebounds and ripples
Get a more effjcient car Bigger economy, more investment in effjciency Drive more Use less fuel More demand for roads; suburbia more viable; bigger houses, etc. Spend it on
Invested via bank or fund Save money Lower global
Carbon footprint Economic activity and/or and More oil use elsewhere Rebound type 1 Rebound type 2 Rebound type 4 Rebound type 3
All charts and facts from The Burning Question by Duncan Clark and Mike Berners-Lee (Profile Books,2013)
Carbon intensity (clean energy)
0.0 0.2 0.4 0.6 0.8 1.0
Carbon intensity
2010 2000 1990 1980 1970 1950
1 2 3 4 5 6 7
Annual change
1960
Annual % change Carbon intensity (tonnes carbon / tonne oil equivalent)
All charts and facts from The Burning Question by Duncan Clark and Mike Berners-Lee (Profile Books,2013)
New energy capacity 2000–2011
500 1000 1500 2000 2500 Renewables Fossil fuels Oil Natural gas Coal Million tonnes
All charts and facts from The Burning Question by Duncan Clark and Mike Berners-Lee (Profile Books,2013)
An age-old feedback
1850 1900 1950 20002008 1875 1925 1975 50 100 150 200 250 300 350 400 450 500 550 600 Microchip Nuclear energy Television Commercial aviation Vacuum tube Gasoline engine Electric motor Steam engine Internet
WWW
Biomass Coal Oil Gas Hydro Nuclear Solar & wind
Global energy use in exajoules
All charts and facts from The Burning Question by Duncan Clark and Mike Berners-Lee (Profile Books,2013)
Text
All charts and facts from The Burning Question by Duncan Clark and Mike Berners-Lee (Profile Books,2013)
Text
All charts and facts from The Burning Question by Duncan Clark and Mike Berners-Lee (Profile Books,2013)
All charts and facts from The Burning Question by Duncan Clark and Mike Berners-Lee (Profile Books,2013)
We can’t minimise the consumption of fossil fuel while also maximising supply!
Infrastructure Lifestyles Fuel industry
All charts and facts from The Burning Question by Duncan Clark and Mike Berners-Lee (Profile Books,2013)
carbon extraction is still rising
1000 2000 3000 4000 5000 6000 2010 1950
Gas Coal Oil
All charts and facts from The Burning Question by Duncan Clark and Mike Berners-Lee (Profile Books,2013)
All charts and facts from The Burning Question by Duncan Clark and Mike Berners-Lee (Profile Books,2013)
All charts and facts from The Burning Question by Duncan Clark and Mike Berners-Lee (Profile Books,2013)
All charts and facts from The Burning Question by Duncan Clark and Mike Berners-Lee (Profile Books,2013)
All charts and facts from The Burning Question by Duncan Clark and Mike Berners-Lee (Profile Books,2013)
Potential CO2 in proven reserves (billion tonnes)
500 1000 1500 2000 2500 Coal Gas Oil Rest of world EU, Africa, AoSIS & Cartagena EU, Africa & AoSIS
All charts and facts from The Burning Question by Duncan Clark and Mike Berners-Lee (Profile Books,2013)
20 22 24 26 28 30 32 34 36 38 2010 2015 2020 2025 2030 2035 50% chance of 2°C Effjciency, 44% Renewables, 21% Biofuels, 4% Nuclear, 9%
CCS, 22%
Existing and planned policies CO2 emissions (gigatonnes)
All charts and facts from The Burning Question by Duncan Clark and Mike Berners-Lee (Profile Books,2013)
extraction – for growth
All charts and facts from The Burning Question by Duncan Clark and Mike Berners-Lee (Profile Books,2013)
All charts and facts from The Burning Question by Duncan Clark and Mike Berners-Lee (Profile Books,2013)
Lots of options…
burden sharing. We need to find ways to encourage others to participate – such as trade.
All charts and facts from The Burning Question by Duncan Clark and Mike Berners-Lee (Profile Books,2013)
All charts and facts from The Burning Question by Duncan Clark and Mike Berners-Lee (Profile Books,2013)
All charts and facts from The Burning Question by Duncan Clark and Mike Berners-Lee (Profile Books,2013)