
SLIDE 1
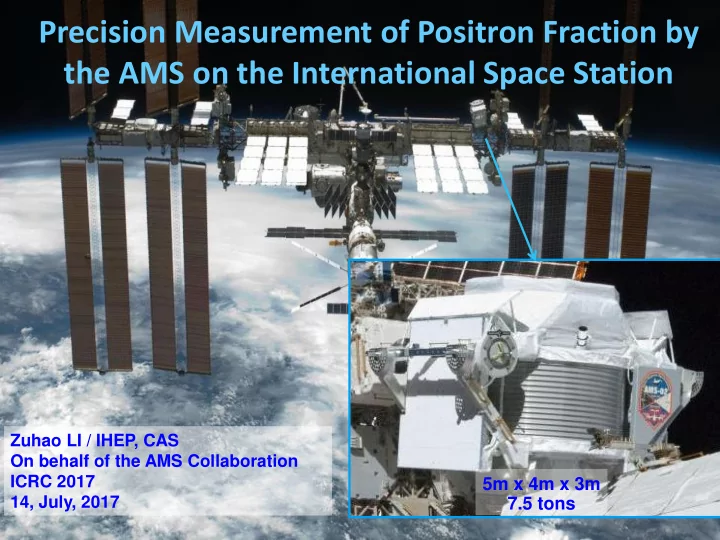
Precision Measurement of Positron Fraction by the AMS on the International Space Station
5m x 4m x 3m 7.5 tons
Zuhao LI / IHEP, CAS On behalf of the AMS Collaboration ICRC 2017 14, July, 2017
the AMS on the International Space Station Zuhao LI / IHEP, CAS On - - PowerPoint PPT Presentation
Precision Measurement of Positron Fraction by the AMS on the International Space Station Zuhao LI / IHEP, CAS On behalf of the AMS Collaboration ICRC 2017 5m x 4m x 3m 14, July, 2017 7.5 tons AMS: A TeV precision, multipurpose, magnetic
5m x 4m x 3m 7.5 tons
Zuhao LI / IHEP, CAS On behalf of the AMS Collaboration ICRC 2017 14, July, 2017
Tracker
1
2
7-8 3-4 9 5-6
Transition Radiation Detector (TRD) Identify e+, e- Silicon Tracker Z, P or R=P/Z Electromagnetic Calorimeter (ECAL) E of e+, e- Ring Imaging Cherenkov (RICH) Z, E Time of Flight (TOF) Z, E
Magnet ±Z
Z and P, E or R are measured independently by Tracker, ECAL, TOF and RICH
Transition Radiation
2
3 Proton rejection at 90% e+ efficiency
Typically, 1 in 1,000 protons may be misidentified as a positron
ISS Data
One of 20 layers
radiator
Rigidity (GV)
TRD estimator = -ln(Pe/(Pe+Pp))
20 layers: fleece radiator and proportional tubes
Protons
Electrons Measurement with 1 of the 20 TRD Layers
Transition Radiation
ISS Data
3
90% 70% 80%
1 5 6 3 4 7 8 9 2
4
Provides a precision, 17 X0, TeV, 3-dimensional measurement of the directions and energies of electrons and positrons, seperate e± from protons
Typically, 1 in 10,000 protons may be misidentified as a positron
Proton rejection at 90% e+ efficiency
Momentum (GeV/c)
Test beam result
Boosted Decision Tree (BDT):
3D shower shape
protons electrons
εe = 90%
ECAL estimator
Probability
5
6
AMS
ISM Collision of Cosmic Rays with the Interstellar Media will produce e+, p…
7
m=800 GeV m=400 GeV
e± energy [GeV] e+ /(e+ + e-)
which it begins to increase.
ceases to increase.
which it falls beyond the turning point.
Dark Matter model based on I. Cholis et al., JCAP 12 (2009) 007.
8
log(E/|P|)
9
The TRD Estimator shows clear separation between protons and positrons with a small charge confusion background
(83.2-100 GeV)
Data Fit Positrons Protons Charge Confusion(e-e+)
10
11
at high energies Two sources: 1) large angle scattering and 2) production of secondary tracks along the path of the primary track. Both are well reproduced by the Monte Carlo. The small difference is taken as a systematic error.
12
173 – 206 GeV Width = 0.006
Positron Fraction Positron Fraction Number of Positron Number of Trials
13
PRL113,121101(2014)
14
15
PRL113, 121101(2014)
16
PRL113, 121101(2014)
17
PRL113, 121101(2014)
18
From Dark Matter
1)
2)
3)
4)
5)
6) K.R. Dienes and J. Kumar, Phys.Rev. D88 (2013) 10, 103509 7)
8)
9)
10)
11)
12)
13)
14) M-Y. Cui, Q. Yuan, Y-L.S. Tsai and Y-Z. Fan, arXiv:1610.03840 (2016) 15)
…….
From Astrophysical Sources
1)
2)
3)
4)
5) P.F. Yin, Z.H. Yu, Q. Yuan and X.J. Bi, Phys.Rev. D88 (2013) 2, 023001 6) A.D. Erlykin and A.W. Wolfendale, Astropart.Phys. 50-52 (2013) 47 7)
8)
9)
10)
11)
……
From Secondary Production
1) R.Cowsik, B.Burch, and T.Madziwa-Nussinov, Ap.J. 786 (2014) 124 2)
3)
4) G.Giesen, M.Boudaud, Y.Gènolini, V.Poulin, M.Cirelli, P.Salati and P.D.Serpico, JCAP09 (2015) 023; 5) C.Evoli, D.Gaggero and D.Grasso, JCAP 12 (2015) 039. 6) R.Kappl, A.Reinertand, and M.W.Winkler, arXiv:1506.04145 (2015) …… 19
(pink band) explaining that the AMS positron fraction (gray circles) above 10 GV is due to propagation effects. However, this requires a specific energy dependence of the B/C ratio
The AMS Boron-to-Carbon (B/C) flux ratio
Cowsik (2014) 11 million nuclei
PRL 117, 231102 (2016)
20
90 (2014) 061301(R) Subir Sarkar: AMS Days@CERN, April 2015
21
The rate of falls predicted by pulsars model and dark matter model are different.
Lineros, A. Vittino, JCAP 1404 (2014) 006
22
Examples: Dark Matter model with intermediate state
M.Cirelli, M.Kadastik, M.Raidal and A.Strumia, Nucl.Phys. B873 (2013) 530
23
PAMELA 2009
M = 1 TeV
Model based on
17 million events Preliminary Data. Please refer to the AMS forthcoming publication in PRL.
24
25
26
27
E>1.2 max cutoff
shower
fiducial ECAL volume
shower
28
MC e- 500-700GeV
29
e± e-
e-e+ p
30
(149-170GeV)
Data Fit
TRD - Charge Confusion Estimator 2D phase space
31
Pulsar Model based on D. Hooper, P. Blasi & P. D. Serpico, JCAP 0901 (2009); K. Iota, PTP 123-4 (2010) 743
Pulsars
Isotropy Current value
Anisotropy of e+/e-
The fluctuations of the positron ratio e+/e− are isotropic 16 < E [GeV] < 350.
Significance
Galactic coordinates (b,l)
Data taking to 2024 will allow to explore anisotropies of 1%
C1 is the dipole moment The anisotropy in galactic coordinates
Astrophysical point sources like pulsars will imprint a higher level of anisotropy on the arrival directions of energetic positrons than a smooth dark matter halo.
32
The AMS Antiproton-to-Proton ratio
Presented by Weiwei XU
Dark matter
Momentum [GeV]
Positron Fraction
M = 1 TeV
AMS 2024
Pulsars
By 2024, AMS will distinguish Dark Matter from Pulsars
Donato et al., PRL102, 071301 (2009);mχ = 1 TeV 33