
SLIDE 1
1
Texas Riparian and Stream Ecosystems
Nikki Dictson
Texas Water Resources Institute http://texasriparian.org and http://www.facebook.com/TexasRiparianAssociation
1
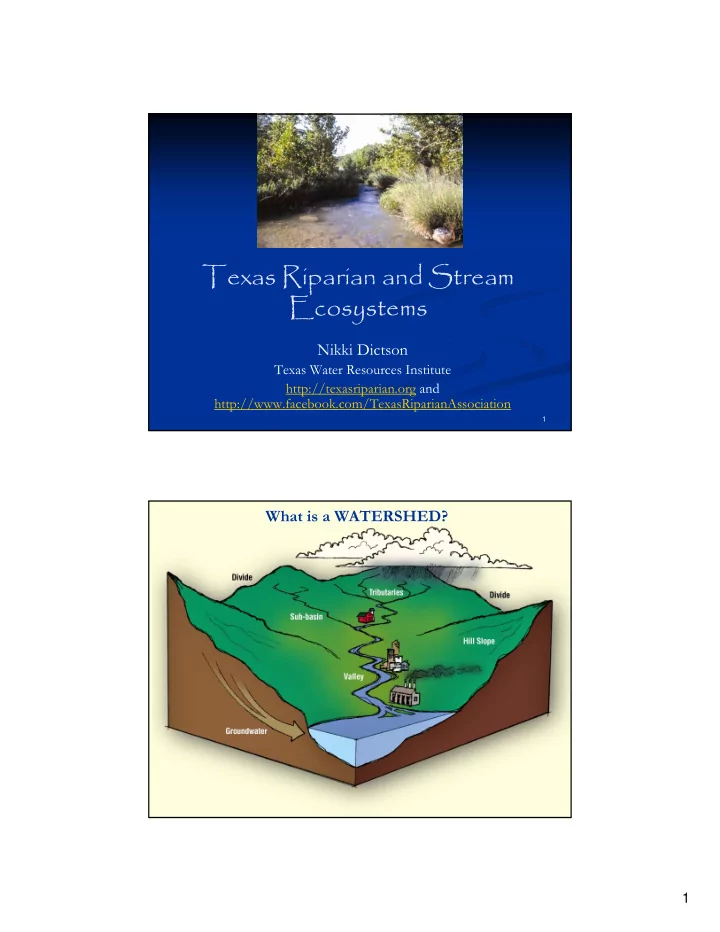
What is a WATERSHED?
Texas Riparian and Stream Ecosystems Nikki Dictson Texas Water - - PDF document
Texas Riparian and Stream Ecosystems Nikki Dictson Texas Water Resources Institute http://texasriparian.org and http://www.facebook.com/TexasRiparianAssociation 1 What is a WATERSHED? 1 WATERSHED Texas Rivers 2 Watershed A Watershed can
1
Nikki Dictson
Texas Water Resources Institute http://texasriparian.org and http://www.facebook.com/TexasRiparianAssociation
1
What is a WATERSHED?
2
3
A Watershed can be characterized as consisting of:
Upland Riparian zone and stream system
Each watershed functions as an ecosystem, i.e., each component affects the rest of the system including the benefits or negative impacts. As water flows through the system the impacts are cumulative.
Upland Riparian Stream
6
4
5
9
6
Derives slopes of stream
Evaluate altitude changes Topo Maps -
7
8
Many factors determine what happens to the rainfall
type, quantity, and density of vegetative cover; storm intensity and duration; soil moisture prior to the storm event; soil water holding capacity; and slope.
These factors affect how much evaporates, infiltrates, moves through vegetation, and the amount and velocity
enter the stream.
A Healthy Watershed is a catchment, i.e., rainfall is captured on-site. It acts as a sponge storing water to later release. “High” infiltration rates due to good vegetation cover and soil organic matter/structure and depth. Water flowing from the uplands as runoff & subsurface flow to springs and aquifers is “clean” and is slowly released down slope.
9
Cumulative impacts of natural and man induced
Management not only affects the individual
Stream and riparian systems are the water
They are one of the most important resources
Most streams and rivers in Texas have been adversely affected by past natural and human activities resulting in:
Increasingly damaging floods Lower base flows High sediment loads Reduced reservoir storage capacity Invasion of exotic species Loss of natural riparian habitats Degraded water quality
10
19
Texas has more than 200,000 miles of rivers and streams with
riparian zones and floodplains that comprise corridors of great economic, social, cultural, and environmental value.
The 2012 303d List has 568 impaired water bodies on it. Many WPP and TMDL Implementation projects are ongoing
across the state to improve WQ in watersheds.
Bacteria is the cause for over 50% and low dissolved oxygen
(nutrients) and organics in fish tissue at 15% each.
Creeks / Riparian Areas are special places that need preferential
treatment.
To manage or restore creeks you must understand them and
then address the issues that are inhibiting natural restoration.
11
Point Source
Permitted Discharges
Wastewater Treatment Plants Industrial Facilities Confined Animal Feeding
Operation
Stormwater
12
Urban Wildlife Feral Hogs Livestock Crops Onsite Septic Facilities
Transport water Transport &
deposit sediment
Transport &
replenish nutrients
Biological
functions (food,
shelter, shading, movement, etc.)
13
25
Soil Water Vegetation
14
Dissipate stream energy Stabilize banks Reduce erosion Trap sediment Build / enlarge floodplain Store water Floodwater retention Groundwater recharge Sustain baseflow Water quality Water quantity Forage Aquatic habitat Wildlife habitat Recreational value Aesthetic beauty
Adequate vegetation, landform or large woody m aterial to:
15
16
17
Catching the water Storing the water in the land An Overlooked Opportunity
“Riparian Sponge”
18
Burro Creek 1981 Burro Creek 2000
19
The patterns of rivers are naturally developed to dissipate the energy of the moving water and to transport sediment. The meander geometry and associated riffles and pools adjust to keep the system operating efficiently.
20
Identify the Components
Channel / Banks Floodplain Sediment Base flow Flood flow Water table Vegetation Large wood Organic debris
The Processes that occur
Erosion / Deposition Bankfull discharge Sinuosity Width : Depth Ratio Gradient / Velocity Recruitment Root density Channel stability Channel evolution Plant succession
21
Streambank and watershed
erosion are natural processes
A dynamic equilibrium exists
in stable stream channels
Floods have beneficial
functions
When changes are made in the
watershed or stream, the stream will adjust to fix itself
A stable stream is one that has a stable dimension,
Lateral migration and erosion do not necessarily
22
23
45
24
Valley Length: 10 ,0 0 0 ft
Elev - 160 0 Elev 150 0 Gradient 1.0 % Gradient 0 .7% Gradient 0 .4% Channel Length 14,0 0 0 ft Channel Length 25,0 0 0 ft
25
Base Flow Bankfull Flow 1 – 2 Year Flood
Active Floodplain Lesson 2: Floodplains Dissipate Energy and Trap Sedim ent High velocity water Low velocity water
26
Water Table Lesson 3: Flooding Recharges Water Tables
27
28
Lesson 5: Down-cutting Drains the Water Table Lesson 6: Down-cutting: Loose Access to Floodplain
Bankfull flow well below floodplain
29
30
Water Table Riparian Sponge
Lesson 7: The Water Table Sustains Base Flow
31
Lesson 8 : Channel Widening Reduces the Riparian Sponge
32
Lesson 9: Overly Wide Channels Reduce Sedim ent Transport Ability
33
Lesson 10 : Degraded and eroded channels can be restored Natural Channel Restoration
34
35
36
37
Early successional stage showing bare stream banks with little vegetative
unrestricted. Mid successional stage showing deposition along stream bank with herbaceous and woody cover developing.
Late successional stage showing deposition of sediment along stream banks, good woody and herbaceous cover, woody debris in floodplain and stream.
Successional Stages
Soil Water Vegetation
38
Protects banks from excess erosion Dissipates energy and slows the velocity of floodwater Sediment dropped Sediment trapped and stabilized Floodplain / riparian sponge is enlarged Increased groundwater recharge Base-flow is sustained over time
Multiple age classes? Plant diversity? Plants indicative of wet conditions? Stabilizing root mass? Plant vigor? Amount of plant cover? Source of large wood?
39
1.
2.
First plants to establish in freshly deposited sediment Often spread rapidly by stolons or rhizomes or rooting at the nodes Roots generally shallow and weak Critical to recovery
40
Strong, robust plants Able to withstand high energy flows Strong, deep, reinforcing root systems Provide bank protection and energy dissipation
1 = Bare ground 10 = Anchored rock or large anchored logs 6/ 7 = Acceptable riparian stability *
41
Spikerush Switchgrass Sycamore Baccharis
42
43
Caring for the Green Zone, Riparian Areas and Grazing Management Alberta Riparian Habitat Management Project, “Cows and Fish Project”
Root Length; Miles per Cubic Foot
22 18.8 8.7 7.2 0.8 0.5 5 10 15 20 25 Spikerush Knotgrass Baltic rush Deergrass Sideoats grama Curlymesquite
Upland plants Riparian plants
67 feet per cubic inch
44 Rootmass; Pounds per Acre
65,000 47,000 27,000 24,000 11,000 4,100 3,100 10,000 20,000 30,000 40,000 50,000 60,000 70,000 Deergrass Baltic rush Spikerush Knotgrass Big bluestem Sideoats grama Curlymesquite
Upland plants Riparian plants
45
Dissipate Energy Reduce Erosion Trap Sedim ent Help Create / Enlarge Riparian Sponge
46
Farming too close to the bank
Mowing, spraying close to the creek
Manicured landscapes next to the creek
Chronic grazing concentrations in creek areas
Excessive deer, exotics, hogs in creek
Burning in riparian area
Removal of large dead wood
Artificial manipulation of banks / sediment
Excessive vehicle traffic in creek area
Poorly designed road crossings / bridges
Excessive recreational foot traffic
Excessive alluvial pumping or other withdrawals
Channelization improves access but destroys the riparian/floodplain functions necessary to maintain healthy streams. Channelization Within Urban Centers
The impacts of stream flow and water quality are
cumulative as the water moves down the system.
Management upstream can lead to positive or negative
impacts downstream.
As you assess the stream and riparian ecosystem think
about what may be hindering it.
Has something caused a change in the water, sediment
Management activities should protect healthy systems
system.
47
Repeating photographs at set locations will allow
Location selection: critical sites along the stream
A tributary or high runoff location Where the stream changes course – point bar or bend Sites that are easily accessible and representative
48
12-2-07 5-2-09 10-2-08 3-10-10 7-14-09 4-8-12 9-15-10 8-14-09 9-10-11 9-2-12
Four photographs should be taken at each observation site:
1) upstream showing the nearest bank , stream channel and
2) perpendicular to the stream of the opposite bank, 3) perpendicular to the stream away on the bank where the
4) downstream showing the channel and both banks if possible.
With a felt pen and a yellow paper pad (white is too
bright), make a sign to include in the photo scene.
Include some identification (stream name, range site, etc.)
concerning the specific scene being photographed and the date.
96
49
Each location should be
permanently marked for future evaluations using a steel stake or on-the-ground reference plus GPS coordinates if possible.
locate the permanent
reference point a “safe” distance inland
Make a map of the stream
showing the location of each permanent marker and the monitoring point.
98