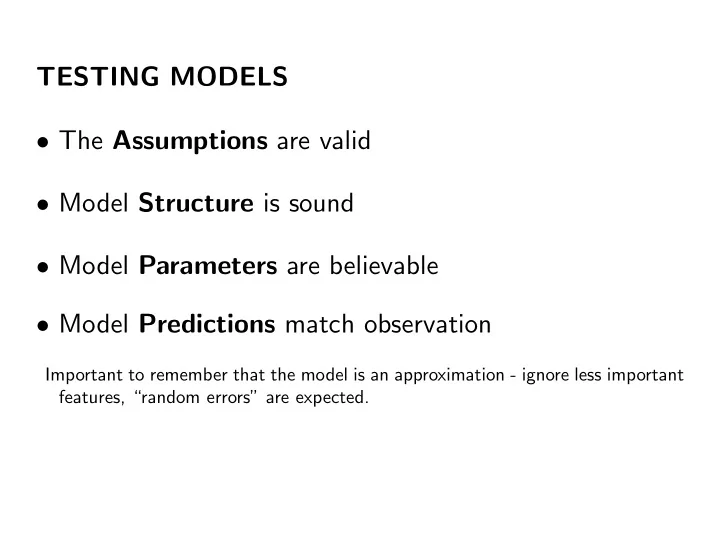
SLIDE 1 TESTING MODELS
- The Assumptions are valid
- Model Structure is sound
- Model Parameters are believable
- Model Predictions match observation
Important to remember that the model is an approximation - ignore less important features, “random errors” are expected.
SLIDE 2 Assumptions
- Consider what the assumptions really are
- What should they be?
e.g. Do we want a linear relationship or any increasing relationship? Assumptions are often models and may need testing as such!
20 40 60 80 100 20 40 60 80 100
Food Eaten Weight gain
SLIDE 3
Model Structure
How sensitive is the model to changes in model structure?
Quantitive changes (predicted value changes) Qualitative changes (nature of prediction changes) Some structures that can change outputs: Stochasticity Non-linearity Modelling physical space explicitly ...! Only qualitative (different behaviour) changes matter at this stage!
SLIDE 4 Example: Changing Model Structure
Lotka-Volterra Predator Prey model: Deterministic model gives stable cycles... Adding ANY noise produces unstable cycles!
20 40 60 80 100 0.6 0.8 1.0 1.2 1.4 1.6 1.8 Time Population
0.5 1.0 1.5 2.0 800 1000 1200 1400 Time Frequency
- Lotka predator−prey model
- Y1
Y2
D, 37.55 sec, 59646 steps (1 steps/point)
SLIDE 5 Parameters
Question: How sensitive is the model to the parameters? Another: how do you find the “best” parameters? Need Goodness of fit measure. Most commonly used are:
- Sum-squared error
- Likelihood
SLIDE 6 Estimating model parameters
Deterministic models
- Minimise mean square error
- Assume normal and uncorrelated errors → std. errors
- Pretend model is true, discrepancy is observation error
- Likelihood L(D | p): probability that the observed errors could happen
Likelihood = exp(− sum of [squared error/standard deviation] ) Stochastic models
- Likelihood L(D | p) is a natural concept
- Only use model assumptions → parameter distributions
- Missing observations must be averaged out
SLIDE 7 Estimating model parameters
To obtain “good” model parameters: Maximise Likelihood (or minimise errors) Many methods to do this:
- Solve for maximum (usually impossible!)
- Numerically find “Maximum Likelihood” (easy, but only local maxima found)
- Simulated Annealing (hard, should find global maxima)
- MCMC (hard, should find global maxima AND give correct parameter
distribution around it)
SLIDE 8 Sensitivity Analysis
(Sensitivity Analysis eds. Saltelli, Chan, Scott.)
MODEL y = f(x1,x2,x3) METHOD
Feedback input distribution Feedback model structure
VARIANCE DECOMPOSITION INPUT
x3 x2 x1
OUTPUT SA
SLIDE 9 Sensitivity Analysis Methods
LOCAL (directional) derivative: Si =
xj yi ∂yi ∂xj
i.e. the relative change from making a small change to each parameter GLOBAL
- Sampling based methods (Monte Carlo, Latin Hypercube Sampling)
- Sensitivity Indices (Importance Measures, SOBOL)
- FAST sampling (Fourier methods)
These are all implemented in the R package “sensitivity”.
SLIDE 10 Sensitivity Analysis Example
p1 p2 p3 Sensitivity 0.0 0.2 0.4 0.6 0.8
Sensitivity Analysis
Model: y = p1 * x1 + p2 * x2 + p3 * x3 Where x1 = Unif(0,1) Where x2 = Unif(0,3) Where x3 = Unif(0,9)
Relative change in output from each input
SLIDE 11
Sensitivity Analysis Example 2
HeathMod Grazing System (MLURI)
SLIDE 12 Prediction
Test model prediction against NEW and INDEPENDENT data! Why:
- We used the old data to fit the model - avoid overfitting
- Want general prediction - not for specific case
e.g. Fit model for a farm. Better to test on different farm, rather than new data for old farm. Otherwise only get good model for one specific farm! Sometimes hard to get new data; instead, resample current data.
- Split data into chunks (e.g. leave one out)
- Randomize over which data used to fit model, which to predict from model
SLIDE 13 Reasons for Prediction Errors
A) “Random” variation B) Excluded effects, i.e. incomplete model C) Wrong model:
- poor model structure
- poor parameter estimates
SLIDE 14 Summary Statistics
Bias B =
i(Oi − Pi)/n
Standard deviation SD = {
i[(Oi − Pi) − B]2/n}
1 2
Prediction mean square error PMSE =
i(Oi − Pi)2/n = B2 + SD2
SLIDE 15 Comparison of Models
Issues to consider include:
- generality
- sensitivity
- predictive ability
NB equations with different functional forms can give similar predictions Subjective element - what is it you want from the model?
SLIDE 16 Information criterion
With Likelihood L, and using k parameters for the model, consider:
- AIC (Akaike Information Criterion)
- BIC (Bayesian Information Criterion)
- DIC (Deviance Information Criterion)
Each has a slightly different form and is built on different assumptions - but usually agree Many (stats) programs provide them routinely Take the form −2 log(L) + f(n) (f = 2k for AIC, klog(n) for BIC, where n is the number of observations) Choose minimum IC value; difference of 10 is very significant, 5 − 10 is strong, 0 − 5 means both models could be right
SLIDE 17 Example: AIC
Model: linear model with 4 components: Each a factor a less important than the last, with noise. Linear model: yi =
j=1:4(ajxij + σij)
40 60 80 100 20 40 60 80 100 Major component Predicted Variable
1 parameter 2 parameters 3 parameters 4 parameters
1.5 2.0 2.5 3.0 3.5 4.0 440 460 480 500 Number of fitted variables AIC
436.9 438.5 440.3
Use lowest AIC for predictions: Only use 2 variables. WHY? The noise swamps out the other 2 and so it isnt worth the extra complexity.
SLIDE 18
Comparing models for cattle growth
Two models for prediction of liveweight gain in growing cattle Notation: MEI = metabolisable energy of daily ration (MJ/d) q = ration of metabolisable to gross energy in the diet Em = energy of maintenance (MJ/d) km = efficiency of utilisation of dietary ME for maintenance L = MEI ∗ km/Em(level of feeding) Eg = energy retained in daily weight change (MJ/d) kg = efficiency of utilisation of dietary ME for weight change EVg = the energy value of tissue lost or gained (MK/kg) W = liveweight (kg) ∆W = liveweight change (kg/d)
SLIDE 19
Comparing models for cattle growth
General The daily energy balance in growing cattle may be represented as follows: MEI = Em km + Eg kg (1) writing Eg = EVg × ∆W we obtain MEI = Em km + EVg × ∆W kg (2)
SLIDE 20
Comparing models for cattle growth
MODEL 1: (AFRC 1980) Em = 0.53(W/1.08)0.67 + 0.0043W km = 0.35q + 0.503 kf = 0.78q + 0.006 kg = kf L − 1 EVg = (4.1 + 0.0332W − 0.000009W 2) 1 − 0.1475∆W ∆W = Eg 4.1 + 0.0332W − 0.000009W2 + 0.1475Eg Eg = kg × (MEI − Em km ).
SLIDE 21
Comparing models for cattle growth
MODEL 2: (TB33) Em = 5.67 + 0.061W km = 0.72 kg = 0.9q EVg = 6.28 + 0.3Eg + 0.0188W Rearranging (2) and substituting for EVg gives ∆W = Eg/(6.28 + 0.0188W + 0.3Eg) where Eg = kg × (MEI − Em/km).
SLIDE 22 Comparing models for cattle growth
- 100
- 200
- 300
- 400
- 500
- 600
- 10
20 30 40 50
M=5.67+0.061W Liveweight W (Kg) M=0.53(W/1.08)0.67+0.0043W Maintenance requirement M (MJ/d)
SLIDE 23
Comparing models for cattle growth
Table A Predictions of liveweight gains (g/d) according to the competing models W (kg) 100 500 MEI(MJ/d) 20 40 60 100 q .46 .68 .57 .68 .46 .68 .57 .68 Model 1 170 351 1112 1322 197 408 1044 1239 Model 2 157 226 947 1070 215 307 1010 1137
SLIDE 24
Comparing models for cattle growth
Table B Bias in predicting liveweight gain (g/d) using independent data (standard deviations in parentheses) Data Set Mean liveweight gain (g/d) Model 1 Model 2 1. (Food, Reading) 1080 210(80) 130(80) 2a. (Hinks, Edinburgh) 660 180(100) 150(100) 2b. 890 130(180) 100(170) 2c. 820 70(120) 50(120) 2d. 970 160(130) 220(130) 3. (Drayton EHF) 730 −10(120) 0(120) 4. (MLC, Nottingham) 910 170(220) 140(210)
SLIDE 25
Working Party Report
Concludes there is little difference in predictive ability Recommends Model 1 because: a) no need for linearizing approximations of Model 2 b) includes terms for known effects absent in Model 1 c) better platform for future development
SLIDE 26 Comparison of two models via precision of parameter estimates
✁
4
✂
6
✄
8
☎
10
0.04 0.06 0.08 0.10 0.12 0.14 P(b|Data 1) P(b|Data 2)
Likelihoods for biological control parameter
Treatment 1 supports model including the biocontrol parameter b Treatment 2 supports simpler model without b