
SLIDE 1
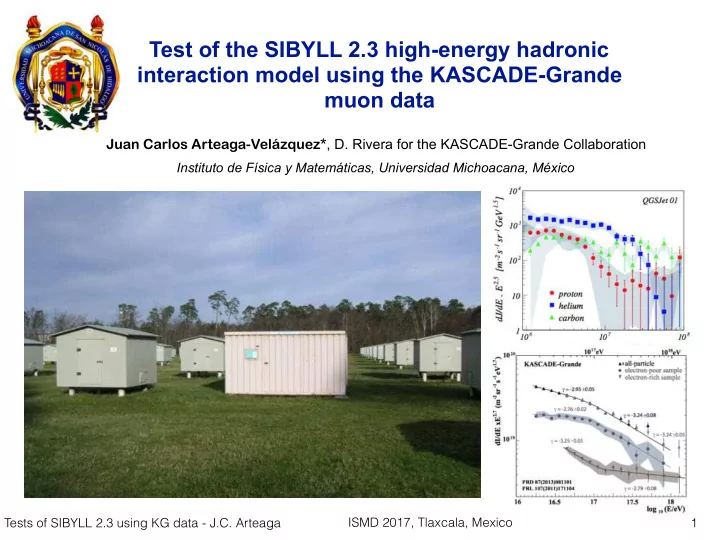
Test of the SIBYLL 2.3 high-energy hadronic interaction model using the KASCADE-Grande muon data
1 Tests of SIBYLL 2.3 using KG data - J.C. Arteaga ISMD 2017, Tlaxcala, Mexico
Test of the SIBYLL 2.3 high-energy hadronic interaction model using - - PowerPoint PPT Presentation
Test of the SIBYLL 2.3 high-energy hadronic interaction model using the KASCADE-Grande muon data Juan Carlos Arteaga-Velzquez* , D. Rivera for the KASCADE-Grande Collaboration Instituto de Fsica y Matemticas, Universidad Michoacana, Mxico
1 Tests of SIBYLL 2.3 using KG data - J.C. Arteaga ISMD 2017, Tlaxcala, Mexico
2 ISMD 2017, Tlaxcala, Mexico Tests of SIBYLL 2.3 using KG data - J.C. Arteaga
30 - 20 km
astrophysical sources (SNR’s, AGN’s, etc?).
detected at Earth through air shower (EAS) observation
hadronic models to study energy and composition
3 ISMD 2017, Tlaxcala, Mexico Tests of SIBYLL 2.3 using KG data - J.C. Arteaga
forward region (pT ~ 0).
0.1 % 0.02 % 99.88 %
4 ISMD 2017, Tlaxcala, Mexico Tests of SIBYLL 2.3 using KG data - J.C. Arteaga
5 ISMD 2017, Tlaxcala, Mexico Tests of SIBYLL 2.3 using KG data - J.C. Arteaga
KASCADE Coll., Astrop. Phys. 24 (2005) 1.
All-particle spectrum
Mass groups Mass groups
6 ISMD 2017, Tlaxcala, Mexico Tests of SIBYLL 2.3 using KG data - J.C. Arteaga
Proton @ 1015 eV, Corsika simulation, F. Schmidt & J. Knapp
ECR = 1015 - 1018 eV Ethμ = 230 MeV, 490 MeV, 800 MeV, 2.4 GeV ECR = 1015 - 1017 eV Ethμ = 0.2 GeV ECR > 1018 eV Ethμ = 1 GeV ECR = 1017 - 1018 eV Ethμ = 10 GeV
7 ISMD 2017, Tlaxcala, Mexico Tests of SIBYLL 2.3 using KG data - J.C. Arteaga
Proton @ 1015 eV, Corsika simulation, F. Schmidt & J. Knapp
ECR = 1015 - 1018 eV Ethμ = 230 MeV, 490 MeV, 800 MeV, 2.4 GeV ECR = 1015 - 1017 eV Ethμ = 0.2 GeV ECR > 1018 eV Ethμ = 1 GeV ECR = 1017 - 1018 eV Ethμ = 10 GeV
8 ISMD 2017, Tlaxcala, Mexico Tests of SIBYLL 2.3 using KG data - J.C. Arteaga
with the atmospheric depth:
cross section, pT distribution,
production,
9 ISMD 2017, Tlaxcala, Mexico Tests of SIBYLL 2.3 using KG data - J.C. Arteaga
2
µ
) °
° = 0 θ KG data ( QGSJET II-2 EPOS LHC SIBYLL 2.1 QGSJET II-04
J.C. Arteaga et al., Astropar. Phys. 95 (2017) 25
*F. Riehn et al., PoS(ICRC2015) 558
10 ISMD 2017, Tlaxcala, Mexico Tests of SIBYLL 2.3 using KG data - J.C. Arteaga
Data
knee 2nd knee γ = -2.7 γ -3.0 γ ~ -3.3 γ = -2.6
11 ISMD 2017, Tlaxcala, Mexico Tests of SIBYLL 2.3 using KG data - J.C. Arteaga
Data
knee 2nd knee γ = -2.7 γ -3.0 γ ~ -3.3 γ = -2.6
12 ISMD 2017, Tlaxcala, Mexico Tests of SIBYLL 2.3 using KG data - J.C. Arteaga
Karlsruhe, Germany 110 m a.s.l., 49o N, 8o E
13 ISMD 2017, Tlaxcala, Mexico Tests of SIBYLL 2.3 using KG data - J.C. Arteaga
W.D. Apel et al., NIMA 620 (2010) 490
14 ISMD 2017, Tlaxcala, Mexico Tests of SIBYLL 2.3 using KG data - J.C. Arteaga
W.D. Apel et al., NIMA 620 (2010) 490
Scintillator detectors
Nµ (> 230 MeV) e/γ detector µ detector Pb/Fe shielding liquid scintillator plastic scint.
15 ISMD 2017, Tlaxcala, Mexico Tests of SIBYLL 2.3 using KG data - J.C. Arteaga
16 Tests of SIBYLL 2.3 using KG data - J.C. Arteaga
QGSJET-II-02/Fluka
KASCADE Coll., Astropart.
KASCADE'Grande.Coll.,. Astropart..Phys..47.(2013)
17 ISMD 2017, Tlaxcala, Mexico Tests of SIBYLL 2.3 using KG data - J.C. Arteaga
KASCADE Coll., Astrop. Phys. 36 (2012) 183
2nd knee 2nd knee
QGSJET-II-02
18 ISMD 2017, Tlaxcala, Mexico Tests of SIBYLL 2.3 using KG data - J.C. Arteaga
ISMD 2017, Tlaxcala, Mexico Tests of SIBYLL 2.3 using KG data - J.C. Arteaga 19
ISMD 2017, Tlaxcala, Mexico Tests of SIBYLL 2.3 using KG data - J.C. Arteaga 20
) θ sec(
1 1.05 1.1 1.15 1.2 1.25 1.3
)
µ
(N
10
log
5.15 5.2 5.25 5.3 5.35 5.4 5.45
MC data (Mixed)
Ε ~1016 eV
SIBYLL 2.3
ISMD 2017, Tlaxcala, Mexico Tests of SIBYLL 2.3 using KG data - J.C. Arteaga 21
) θ sec(
1 1.05 1.1 1.15 1.2 1.25 1.3
)
µ
(N
10
log
5.15 5.2 5.25 5.3 5.35 5.4 5.45
MC data (Mixed)
Ε ~1016 eV
SIBYLL 2.3
J = constant
ISMD 2017, Tlaxcala, Mexico Tests of SIBYLL 2.3 using KG data - J.C. Arteaga 22
)
µ
(N
10
log 5 5.5 6 6.5 7 )
sr
s
) (m
µ
J(>N
10
10
10
10
10
10
KG data
θ ≤
θ ≤
θ ≤
θ ≤
θ ≤
) θ sec( 1 1.05 1.1 1.15 1.2 1.25 1.3 )
µ
(N
10
log 4.8 5 5.2 5.4 5.6 5.8 6 6.2 6.4
[J] = -9.80
10
log [J] = -8.60
10
log
KG Data
ISMD 2017, Tlaxcala, Mexico Tests of SIBYLL 2.3 using KG data - J.C. Arteaga 23
J.C. Arteaga et al., Astropar. Phys. 95 (2017) 25
QGSJET-II-2 QGSJET-II-4 SIBYLL 2.1 SIBYLL 2.3 EPOS-LHC
2
µ
) °
° = 0 θ KG data (
QGSJET II-2 SIBYLL 2.3 SIBYLL 2.1 QGSJET II-04 EPOS LHC
MC data also include:
intensity
*Errors on SIBYLL 2.3 are preliminary
Discrepancy between SIBYLL 2.3 and measurement is small, but large uncertainty from composition ISMD 2017, Tlaxcala, Mexico Tests of SIBYLL 2.3 using KG data - J.C. Arteaga 24 MC data points: Mixed composition
)
µ
(N
10
log 4 4.5 5 5.5 6 6.5 7 7.5 )
ch
(N
10
)/log
µ
(N
10
log 0.4 0.5 0.6 0.7 0.8 0.9 1 1.1 1.2
Events 1 10
2
10
3
10
4
10
5
10
KG data °
° = 0 θ 12.392 million events
J.C. Arteaga et al., (KG Collab.) PoS (ICRC2017) 316
ISMD 2017, Tlaxcala, Mexico Tests of SIBYLL 2.3 using KG data - J.C. Arteaga 25 Full data
16
17
18
1.5
2.5
14
15
16
17
18
19
KG (SIBYLL 2.3) H He+C Heavy Akeno (J.Phys.G18(1992)423) AGASA (ICRC 2003) HiResI (PRL100(2008)101101) HiResII (PRL100(2008)101101) Yakutsk (NewJ.Phys11(2008)065008) AUGER (ICRC 2013)
EAS-TOP (Astrop.Phys.10(1999)1) TIBET-III (ApJ678(2008)1165) GAMMA (J.Phys.G35(2008)115201) TUNKA (Nucl.Phys.B,Proc.Sup.165(2007)74) KASCADE (QGSJET01 Astrop.Phys.24(2005)1) KASCADE (SIBYLL2.1 Astrop.Phys.24(2005)1) µ KASCADE-Grande (QGSJET II) Nch-N µ KASCADE-Grande (EPOS-LHC) Nch-N KG (SIBYLL 2.3)
J.C. Arteaga et al., (KG Collab.) PoS (ICRC2017) 316
ISMD 2017, Tlaxcala, Mexico Tests of SIBYLL 2.3 using KG data - J.C. Arteaga 26
2
µ
) °
° = 0 θ KG data ( QGSJET II-2 SIBYLL 2.3 SIBYLL 2.1 QGSJET II-04 EPOS LHC
QGSJET-II-2 QGSJET-II-4 SIBYLL 2.1 SIBYLL 2.3 SIBYLL 2.3 EPOS-LHC
Composition model
*Errors on SIBYLL 2.3 are preliminary
SIBYLL 2.3 has also problems to describe the data ISMD 2017, Tlaxcala, Mexico Tests of SIBYLL 2.3 using KG data - J.C. Arteaga 27
ISMD 2017, Tlaxcala, Mexico Tests of SIBYLL 2.3 using KG data - J.C. Arteaga 28
J.C. Arteaga & D. Rivera et al., (KG Collab.) PoS (ICRC2017) 316
]
(r) [m
µ
ρ
1 −
10 1 10 protons Fe KG data Sibyll 2.3 ]
∈ θ [6.55,6.8] ∈
ch
N
10
log
r [m]
200 400
]
(r) [m
µ
ρ
1 −
10 1 10 ]
∈ θ
[7.04,7.28] ∈
ch
N
10
log
r [m]
200 400
[7.52,7.74] ∈
ch
N
10
log
r [m]
200 400
ch
N
10
log
6 7
µ
N
10
log
4.5 5 5.5 6 6.5 7 protons Fe KG data Sibyll 2.3 ]
∈ θ
ch
N
10
log
6 7 ]
∈ θ
ch
N
10
log
6 7 ]
∈ θ
ISMD 2017, Tlaxcala, Mexico Tests of SIBYLL 2.3 using KG data - J.C. Arteaga 29
J.C. Arteaga & D. Rivera et al., (KG Collab.) PoS (ICRC2017) 316
ISMD 2017, Tlaxcala, Mexico Tests of SIBYLL 2.3 using KG data - J.C. Arteaga 30