TEMPERATURE Definition: Measure of the average kinetic energy of the - - PowerPoint PPT Presentation

temperature
SMART_READER_LITE
LIVE PREVIEW

TEMPERATURE Definition: Measure of the average kinetic energy of the - - PowerPoint PPT Presentation

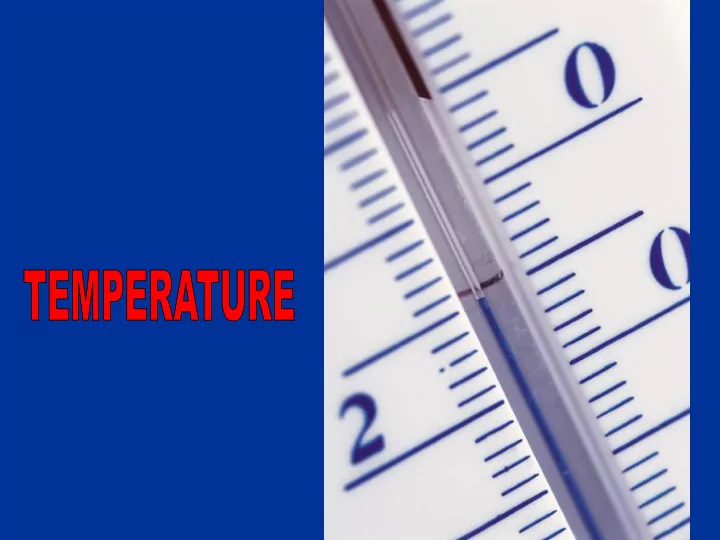
TEMPERATURE Definition: Measure of the average kinetic energy of the molecules in substance Therefore, the faster the speed, the higher the temperature TEMPERATURE ICE WATER VAPOR 0F 212F Slower Molecules Faster Molecules TEMPERATURE


slide-1
SLIDE 1
slide-2
SLIDE 2

Definition: Measure of the average kinetic energy of the molecules in substance

Therefore, the faster the speed, the higher the temperature

TEMPERATURE

slide-3
SLIDE 3

ICE WATER VAPOR 0ºF 212ºF

TEMPERATURE

Slower Molecules Faster Molecules

slide-4
SLIDE 4

TEMPERATURE MEASUREMENTS

Ahrens

slide-5
SLIDE 5

High-altitude temperature plot

Ahrens

slide-6
SLIDE 6

GLOBAL AVERAGE SURFACE TEMPERATURE

When are the highest temperatures observed? WHY?

Your book

slide-7
SLIDE 7

FACTORS AFFECTING TEMPERATURE

Thus, it is not only the incoming solar radiation that controls the temperature of our planet

What controls temperature?

  • A. Incoming Solar Radiation, Tilt, Latitude
  • B. Altitude (Elevation)
  • C. Water Effects
  • D. Surface Type and Aspect
  • E. Weather
slide-8
SLIDE 8

LATITUDE EFFECTS

slide-9
SLIDE 9

LATITUDE EFFECT

slide-10
SLIDE 10

Global Warming observed…

slide-11
SLIDE 11

 Temperature typically decreases with

height in the troposphere...

 ...this rate of decrease (LAPSE RATE) is

~3.6°F every 1000 feet or 6.5°C every 1000 meters.

ALTITUDE EFFECT

slide-12
SLIDE 12

Warm Cold 5000 Temperature decreases 6.5°C every 1000 m.

slide-13
SLIDE 13

ALTITUDE EFFECT

slide-14
SLIDE 14

ALTITUDE EFFECT

  • Temperature typically

decreases with height in the troposphere... EXCEPT during a TEMPERATURE INVERSION (calm, clear mornings) OFTEN LEADS TO POOR AIR QUALITY

slide-15
SLIDE 15

WATER EFFECTS

There are two different effects of water

  • n temperature:

1) Proximity to large bodies of water 2) Proximity to ocean currents

slide-16
SLIDE 16

WATER EFFECTS – PROXIMITY TO LARGE BODIES OF WATER

  • The specific heat capacity of water is greater than that of
  • land. Water will heat/cool a lot slower than land. It takes

more energy to heat/cool water than land.

  • During winter: land is colder than ocean
  • During summer: land is warmer than ocean
slide-17
SLIDE 17

PROXIMITY TO LARGE BODIES OF WATER

LAND TEMPERATURES EXHIBIT MORE SEASONALITY

slide-18
SLIDE 18

PROXIMITY TO LARGE BODIES OF WATER

LAND TEMPERATURES EXHIBIT MORE SEASONALITY

slide-19
SLIDE 19

MAJOR OCEAN CURRENTS

slide-20
SLIDE 20

PROXIMITY TO OCEAN CURRENTS

slide-21
SLIDE 21

PROXIMITY TO OCEAN CURRENTS

slide-22
SLIDE 22

USA TEMPERATURE RECORDS

slide-23
SLIDE 23

USA TEMPERATURE RECORDS

slide-24
SLIDE 24

Trenton Temperature Normals

slide-25
SLIDE 25

QUESTION

  • Why is the maximum daily temperature

for Trenton reached in the end of July/beginning of August and not on June 23 (Summer Solstice)?

  • Heat Capacity of Land and Air
slide-26
SLIDE 26
slide-27
SLIDE 27
slide-28
SLIDE 28

The Urban Heat Island Effect at Fairbanks, Alaska by

  • N. Magee,1 J. Curtis,2, G. Wendler,2

(1) Permanent address: Penn State University, 502 Walker Building, University Park, College

  • Station. PA 16802-5013

(2) Geophysical Institute University of Alaska Fairbanks, Alaska 99775 Abstract: Theoretical & Applied Climatology (Vol. 64, pages 39-47) Using surface observation comparisons between Fairbanks and rurally situated Eielson Air Force Base in Interior Alaska, the growth of the Fairbanks heat island was studied for the time period 1949-1997. The climate records were examined to distinguish between a general warming trend and the changes due to an increasing heat island effect. Over the 49-year period, the population

  • f Fairbanks grew by more than 500%, while the population of Eielson remained relatively
  • constant. The mean annual heat island observed at the Fairbanks International Airport grew by

0.4°C, with the winter months experiencing a more significant value of 1.0°C. Primary focus was directed toward long-term heat island characterization based on season, wind speed, cloud cover, and time of day. In all cases, minimum temperatures were affected more than maxima and periods of calm or low wind speeds, winter clear sky conditions, and nighttime exhibited the largest heat island effects.

slide-29
SLIDE 29
slide-30
SLIDE 30
slide-31
SLIDE 31

TEMPERATURE CYCLE – WEATHER AND THE DIURNAL CYCLE

  • Besides varying from month to month

and day to day, the temperature at any location also varies within a day. For example, we all know that daytime is usually warmer than nighttime.

  • Furthermore weather factors such as:

advection, clouds and sun, precipitation, and humidity all affect temperature

slide-32
SLIDE 32

DIURNAL TEMPERATURE CYCLE

  • Maximum daily temperature is usually

reached in the afternoon

  • Minimum daily temperature is usually

reached right before sunrise

slide-33
SLIDE 33

DIURNAL TEMPERATURE CYCLE

slide-34
SLIDE 34

TCNJ, Month to date

slide-35
SLIDE 35