TEMPERATURE COMPENSATED FBG STRAIN SENSORS FOR MONITORING OF WIND - - PDF document

temperature compensated fbg strain sensors for monitoring
SMART_READER_LITE
LIVE PREVIEW

TEMPERATURE COMPENSATED FBG STRAIN SENSORS FOR MONITORING OF WIND - - PDF document

18 TH INTERNATIONAL CONFERENCE ON COMPOSITE MATERIALS TEMPERATURE COMPENSATED FBG STRAIN SENSORS FOR MONITORING OF WIND TURBINE BLADE K. Choi 1 , G. Kim 1 , C. Kim 1 , I. Kwon 1* , D. Yoon 1 1 Center for Safety Measurement, Korea Research


slide-1
SLIDE 1

18TH INTERNATIONAL CONFERENCE ON COMPOSITE MATERIALS

1 Introduction The size of wind turbine blades has gradually been increased to improve the efficiency of wind power generation in recent years. These big wind turbine blades may experience harsh environment such as gust wind, bird strike, and lightning etc that make some damages in the blades [1]. Therefore, the monitoring of strain and temperature of the blades is very important to operate them safely, and can reduce their maintenance costs. Fiber optic sensors have been deeply considered in blade damage detection techniques such as acoustic emission and ultrasonic detection [2-6]. However, fiber optic sensors need to compensate temperature effects in strain sensing signals [7]. In this study, a dual fiber Bragg grating (FBG) sensor probe molded with epoxy is proposed to measure the strain with temperature compensation of wind turbine blades. Both temperature and strain dependencies of the epoxy molded FBG probe are investigated and

  • analyzed. Also, some FBG sensor signals are

acquired from a blade bending test and analyzed to get the deformation behavior of the blade. 2 Sensing principle of a dual FBG sensor The Bragg wavelength (B) of fiber Bragg grating is affected by strain and temperature changes. The relative change in the B due to strain and temperature change is expressed as

[( ) (1 ) ]

B B e

T p

(1)

B T

K T K

(2) where is thermal expansion and is thermo-optic coefficient,

e

P is the effective photo-elastic constant

  • f fiber core material, and

T

K and K are strain and

temperature coefficients respectively.

1 1 1 2 2 2 1 2 2 1

1 ( )

b T b T T T

K K T K K K K K K

(3) For two Bragg wavelength shifts to be observed, the resulting two equations can be expressed in a matrix

  • form. The changes of temperature and strain can be

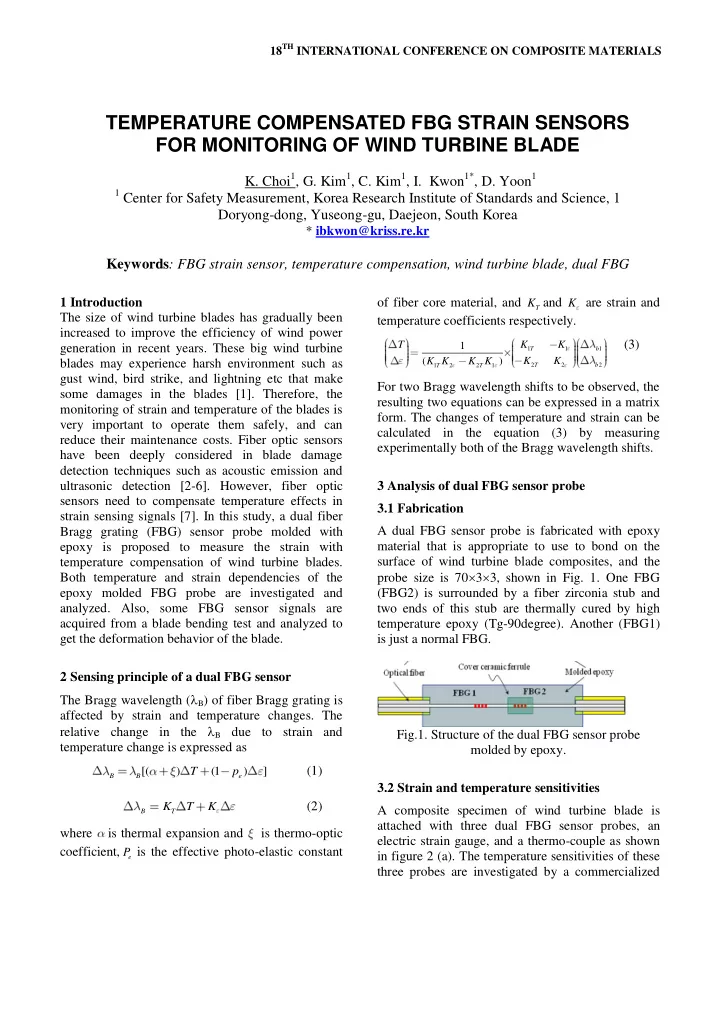
calculated in the equation (3) by measuring experimentally both of the Bragg wavelength shifts. 3 Analysis of dual FBG sensor probe 3.1 Fabrication A dual FBG sensor probe is fabricated with epoxy material that is appropriate to use to bond on the surface of wind turbine blade composites, and the probe size is 7033, shown in Fig. 1. One FBG (FBG2) is surrounded by a fiber zirconia stub and two ends of this stub are thermally cured by high temperature epoxy (Tg-90degree). Another (FBG1) is just a normal FBG. Fig.1. Structure of the dual FBG sensor probe molded by epoxy. 3.2 Strain and temperature sensitivities A composite specimen of wind turbine blade is attached with three dual FBG sensor probes, an electric strain gauge, and a thermo-couple as shown in figure 2 (a). The temperature sensitivities of these three probes are investigated by a commercialized

TEMPERATURE COMPENSATED FBG STRAIN SENSORS FOR MONITORING OF WIND TURBINE BLADE

  • K. Choi1, G. Kim1, C. Kim1, I. Kwon1*, D. Yoon1

1 Center for Safety Measurement, Korea Research Institute of Standards and Science, 1

Doryong-dong, Yuseong-gu, Daejeon, South Korea

* ibkwon@kriss.re.kr

Keywords: FBG strain sensor, temperature compensation, wind turbine blade, dual FBG

slide-2
SLIDE 2

FBG interrogator during heating up process using a forced convection oven. In the graph of Fig. 2 (b), the temperature sensitivities of normal FBGs are fitted to about 40 pm/°C, and that of covered FBGs are about 20 pm/°C. The strain sensitivities of normal and covered FBGs are about 1.0 pm/micro- strain and 0.20 pm/micro-strain, respectively. (a)

20 30 40 50 60 70 80 90 0.0 0.5 1.0 1.5 2.0 2.5

Covered FBG P1-1 P1-2 P2-1 P2-2 P3-1 P3-2

Temperature (degree) Wavelength shift (nm)

Normal FBG

(b) Fig.2. (a) Composite blade specimen with dual FBG probes, and (b) temperature sensitivities of dual FBG probes. (a) Sensor location on blade web (b) Sensor attachment on blade web Fig.3. Location of the FBG sensor probes and electrical strain gauge attached on the web surface of 100 kW wind turbine blades. (a) Measurement spectral peaks

50 100 150 200 250 300 0.00 0.02 0.04 0.06 0.08 0.10 0.12 probe 1 probe 2 probe 3 probe7 probe 8 probe 9

Wavelength shift (nm) Time (min)

(b) Single FBG probe

50 100 150 200 250 0.00 0.02 0.04 0.06 0.08 0.10 probe4(1) probe4(2) probe5(1) probe5(2) probe6(1) probe6(2)

Wavelength shift (nm) Time (min)

(c) Dual FBG probes Fig.4. Bragg wavelength monitoring during installation of probes. 4 Application of FBGs on a blade 4.1 Installation of FBG sensor probes An FBG sensor array of six single FBG probes for strain monitoring, a temperature FBG probe, and three dual FBG probes are installed on the surface of a web in a 100 kW blade. As shown in Figure 3, the FBG sensor probes and the conventional electrical strain gauges are located on the upper and lower part

  • f the web at 1 m each through the whole length of

the web. Figure 4(a) shows the spectral peaks of FBG sensor probes measured by a commercialized

slide-3
SLIDE 3

3 PAPER TITLE

FBG interrogator. Bragg wavelength shifts are monitored during four hours after bonding on the web surface as shown in Fig. 4 (b) and (c). 4.2 Blade test setup A 100 kW FRP blade with 20 FBG sensor probes and 18 electrical strain gauges installed along the length direction of a web surface are tested under static load condition at center for safety measurement of KRISS (Korea Research Institute of Standards and Sciences). This blade is loaded at two points which are connected one load saddle and another spreader bar as shown in Fig. 5. The blade deflections are monitored at four locations by using four LVDTs (Linear Variation Displacement Transducer), and applied loads are also measured by two load cells mounted on the center of the load spreader bar and load saddle (see Fig. 5 and Table 1). The maximum test loads are designed from 1000 N to 1070 N at the three load saddles. The blade is loaded by the increment, 20 % of the maximum load. The step load is applied up to 70 % at the load step

  • f 20 %.

Fig.5. Blade test setup with three point whiffle-tree for static load test. Table 1. Location of load saddle, load cell and LVDT. # Load cell (m) Load saddles (m) LVDT (m) 1 5.8 4.8 4 2 9.6 6.8 7 3 9.6 9 4 11, tip Two array of FBG sensor probes, 18 strain gauges are used to monitor strain of the blade. Load and deflection were monitored by two load cells and four LVDTs located as shown in table 1 respectively.

20 % 40 % 60 % 70 %

  • 4000
  • 2000
  • 400

400

Wavelength shift (pm) Applied load

FBG #1 FBG #2_1 FBG #3 FBG #4_1 FBG #5 FBG #6_1 FBG #7 FBG #8 FBG #9

(a) FBG sensors

20 % 40 % 60 % 70 %

  • 4000
  • 2000
  • 400

400 SG on 1 SG on 2 SG on 3 SG on 4 SG on 5 SG on 6 SG on 7 SG on 8 SG on 9

Strain () Applied load

(b) Electrical strain gages

100 200 300 400 500 600 700 300 600 900 1200 1500

Deflection (mm) Load (N)

(c) Load – deflection curve Fig.6. Measurement data: (a) wavelength shifts of FBG sensor probes, (b) electrical strain gages, and (c) tip deflection according to applied load.

slide-4
SLIDE 4

1000 2000 3000 4000 5000 100 200 300 400 500 600

Time (0.1 sec)

FBG probes #13_1, FBG probes #13_2 SG on 13

Wavelength shift (pm)

100 200 300 400 500 600

Strain ()

1000 2000 3000 4000 5000

  • 600
  • 500
  • 400
  • 300
  • 200
  • 100

Time (0.1 sec)

FBG probes #4_1, FBG probes #4_2, SG on 4

Wavelength shift (pm)

  • 600
  • 500
  • 400
  • 300
  • 200
  • 100

Strain ()

(a) at 4 m location

1000 2000 3000 4000 5000 100 200 300 400 500 600

Time (0.1 sec)

FBG probes #15_1, FBG probes #15_2 SG on 15

Wavelength shift (pm)

100 200 300 400 500 600

Strain ()

1000 2000 3000 4000 5000 6000

  • 600
  • 500
  • 400
  • 300
  • 200
  • 100

Time (0.1 sec)

FBG probes #6_1, FBG probes #6_2, SG on 6

Wavelength shift (pm)

  • 600
  • 500
  • 400
  • 300
  • 200
  • 100

Strain ()

(b) at 6 m location Fig.7. Wavelength shifts of dual FBG probes without temperature compensation. 5 Test results Static load test is performed by increasing the step load as 20 % of the maximum blade load. When the step load is reaching 60% of the maximum load, the loading had to be stop because of occurring abnormal damages in the blade, and also some rupture signals of FBG sensor probes and electrical strain gauges. Then the test is finished at 70 % of maximum load. Figure 6 shows the wavelength shifts (a) of FBG sensor probes and the strains (b) measured by electrical strain gages, and tip deflection (c). FBG sensor probes and strain gauges are placed on the blade web at the interval of one

  • meter. At the location (sensor #2) of about one meter

from blade root, the blade is under large strain with similar pattern between FBG sensor probes and electrical strain gauges as shown in Fig. 6 (a) and (b). Compressive strains are shown at the entire location

  • f the blade except for #1 and #9 locations. The

load - deflection curve of Fig. 6 (c) shows the indication of some damages at about 60 % load. Debonding damage is observed along the bonding line between upper and lower skin of leading edge region at 1 m location. Figure 7 shows the wavelength shifts of normal FBGs and covered FBGs corresponding to the increasing strains by loading. The upper graph of Fig. 7 (a) shows the positive wavelength shifts of FBG sensor probes and the tensile strain of an electrical strain gauge installed on the upper part of the web that is located at 4 meter from the blade root and the another graph shows also the compressive strain and the negative wavelength shifts. That is because the sensors are located at the lower part of the web. In Figure 7 (b), the strains and the wavelength shifts are shown positive and negative values as the same reason of Figure 7 (a) except for the sensor location

  • f 6 m from the blade root. It is concluded that, from

this figure, the strain sensitivities of normal FBGs and covered FBGs are different from that of bared FBGs if it is considered that the strain sensitivity of bared FBG is usually 1 pm/micro-strain. To acquire an accurate strain corresponding to the electrical strain gauge, dual FBG sensor probes are needed to be compensated by temperature according to Eq. 3 using the wavelength shifts of normal FBGs and covered FBGs. Figure 8 shows that the actual strains are calculated from the wavelength shifts of two FBGs

slide-5
SLIDE 5

5 PAPER TITLE

in each dual FBG sensor probe shown in Figure 7. These calculated strains of dual FBG sensor probes are same as the strain values measured by electrical strain gauges. During the load test, the temperature variation is very small less than about one degree Celsius in Figure (c) because the test is performed within 1 hour. Also, the tip deflection of the blade measured by LVDT is shown in Figure 6 (c).

1000 2000 3000 4000 5000

  • 300
  • 200
  • 100

100 200 300

Time (0.1 sec)

  • Cal. FBG probes #4
  • Ele. strain gauge #4
  • Cal. FBG probes #13
  • Ele. strain gauge #13

Calcualted strain ()

  • 300
  • 200
  • 100

100 200 300

#4

Measured strain ()

#13

(a)

1000 2000 3000 4000 5000

  • 200
  • 100

100 200 300

#6 #15 Time (0.1 sec)

  • Cal. FBG probes #6
  • Elec. strain gauge #6
  • Cal. FBG probes #15
  • Elec. strain gauge #15

Calculated strain ()

  • 200
  • 100

100 200 300

Measured strain ()

(b)

100 200 300 400 500 600

  • 2
  • 1

1 2

Caculated temperature (T, degree) Time (sec)

web top-4m web top-6m web bottom-4m web bottom-6m

(c) Fig.8. Calculated strains of dual FBG probes installed on 4 m (a) and 6 m (b), and calculated temperature at each position (c) The tip deflection of the blade is calculated by finite difference method using the calculated strains of FBG sensor probes in Figure 8. The relationship between deflection and strain is devised from arbitrary beam bending and moment theory. The blade is assumed as having a primary structural component of the web and the secondary structural components of the skin. In this assumption, the calculated FBG strains can be used to determine the tip deflection of the blade. The tip deflection calculated by FBG strains is well fitted at the low load range lower than 60 % load as shown in Fig. 9.

1 2 3 4 5 6 7 8 9

  • 800
  • 600
  • 400
  • 200

Load step

Measured tip deflection Calculated tip deflection

Measured tip deflection (mm)

  • 800
  • 600
  • 400
  • 200

Calculated tip deflection (mm)

Fig.9. Comparison between data sets measured by LVDT and calculated tip deflection 6 Discussion In order to measure strain accurately with temperature compensation, two fiber Brag gratings in a probe are molded in one package to have different sensitivities to calculate strain and

  • temperature. Also, a multiplexed FBG sensor array

including dual FBG sensor probes is installed in the web region of the 100kW wind-turbine blade to measure strain. The calculated strains are determined by the strain-wavelength equation. Also, the temperatures are calculated from the temperature- wavelength equation. In this compensation process, the strain can be determined by extracting the temperature effect on the strain signal. These calculated strains are well determined and the temperatures are also found. Temperature compensated strains will be measured from future tests in long term affeted by large temperature

  • chagnes. The tip deflection of the blade is
slide-6
SLIDE 6

determined by converting the strain to the deflection using simple beam-deflection theory by finite difference method. Error occurred over 60 % of the blade maximum load, and it will be corrected by improving the deflection calculation model. Acknowledgement This work was supported by New & Renewable Energy R&D program of Korea Institute of Eneragy Technology Evaluation and Planning (KETEP) grant funded by Korea government Ministry

  • f

Knowledge Economy (2008-N-WD08-P-01-0000). References

[1] J. A. Paquette and P.S. Veers “Increased strength in wind turbine blades through innovative structural design”, EWEC, 2007. [2] C. C. Ciang, J.-R. Lee and H.-J. Bang "Structural health monitoring for a wind turbine system: a review

  • f damage detection methods", Meas. Sci. Technol.

Vol.19, pp 1-20, 2008. [3] E. Schulze, L. Schubert and B. Frankenstein “Monitoring of a Wind Turbine Rotor Blade with Acousto Ultrasonics and Acoustic Emission Techniques During a Full Scale Fatigue Test,” European workshop on structural health monitoring, pp 1229-1234, 2010. [4] L.C.T. Overgaard, E. Lund “Structural collapse of a wind turbine blade. Part B: Progressive interlaminar failure models,” Composites Part A: Applied Science and Manufacturing, Vol. 41, Issue 2, pp 271-283, 2010. [5] Henrik Stensgaard Toft, Kim Branner, Peter Berring, John Dalsgaard Sørensen “Defect distribution and reliability assessment of wind turbine blades,” Engineering Structures, Vol. 33 pp 171-180, 2011. [6] I. Amenabar, A. Mendikute, A. Lopez-Arraiza, M. Lizaranzu and J. Aurrekoetxea “Comparison and analysis of non-destructive testing techniques suitable for delamination inspection in wind turbine blades,” Composites Part B:Engineering, Vol. 42, Issue 5, pp 1298-1305, 2011. [7] M. H. Song, et al. "Simultaneous measurement of temperature and strain using two fiber Bragg gratings embedded in a glass tube," Optical Fiber Technology

  • Vol. 3, No. 2, pp 194-196, 1997.