techno economic analysis of semicontinuous production of
play

Techno-economic analysis of semicontinuous production of - PDF document

4/4/2018 1 Techno-economic analysis of semicontinuous production of recombinant butyrylcholinesterase in transgenic rice cell suspension cultures Jasmine M. Corbin 1 , Matthew J. McNulty 1 , Karen A. McDonald 1,2 , and Somen Nandi 1,2 . 1.


  1. 4/4/2018 1 Techno-economic analysis of semicontinuous production of recombinant butyrylcholinesterase in transgenic rice cell suspension cultures Jasmine M. Corbin 1 , Matthew J. McNulty 1 , Karen A. McDonald 1,2 , and Somen Nandi 1,2 . 1. Department of Chemical Engineering, University of California, Davis, CA, USA 2. Global HealthShare Initiative, University of California, Davis, CA, USA ACS 255 th National Meeting: Disruptive Bioprocessing & Process Integration March 21, 2018 
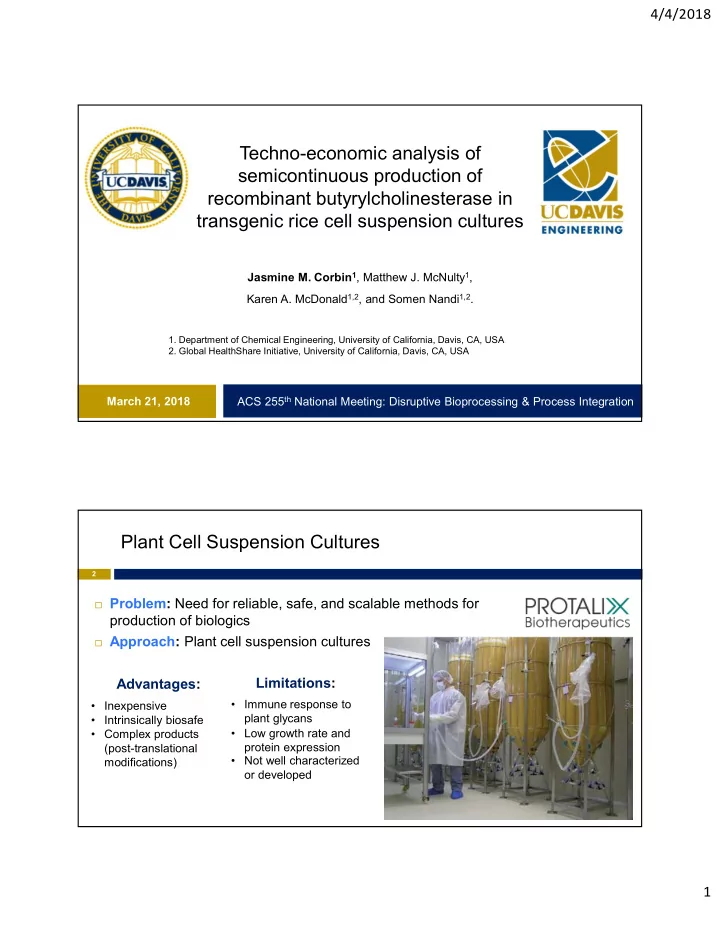
Plant Cell Suspension Cultures 2  Problem: Need for reliable, safe, and scalable methods for production of biologics  Approach: Plant cell suspension cultures Limitations: Advantages: • Immune response to • Inexpensive plant glycans • Intrinsically biosafe • Low growth rate and • Complex products protein expression (post-translational • Not well characterized modifications) or developed 1

  2. 4/4/2018 Butyrylcholinesterase from Transgenic Rice Cell Suspension Cultures 3 Butyrylcholinesterase (BChE):  Bioscavenger for nerve agents  Human BChE from plasma = $20k per 400 mg dose  340 kDa tetramer Top view  14 disulfide bonds  36 N-glycosylation sites Rice cell suspension culture:  Dedifferentiated cells from Oryza sativa  Codon optimized human BChE gene Side view  Inducible promoter activated by sugar starvation Pan YM, et al . 2009. J Phys Chem. Semicontinuous Bioreactor Operation 4 1. Expression level: ~60 µg BChE/g FW (4 mg/L culture) in 10L bioreactor 2. Continuous 5/5 day cycling for >6 months with no decrease in expression level Corbin JM, et al. 2016. Frontiers in Plant Science. 7:1-9. 2

  3. 4/4/2018 Laboratory Scale Downstream Processing 5 Homogenization Clarification Microfiltration SDS-PAGE >95% purity of active BChE Concentration & Diafiltration (TFF) Affinity Chromatography AEX Chromatography (Hupresin) (DEAE) Western blot Corbin JM, et al. 2018. Biotechnology and Bioengineering:1-10. Design Parameters and Assumptions: Upstream 6 Production Target: 25 kg pure BChE year Current Projected (Laboratory Scale) (Manufacturing Scale) Initial culture density: 7 10 g FW/L Final culture density: 70 100 g FW/L Doubling time: 4 3 days Time, Initial to final density: 13 10 days Growth duration: 5 4 days Expression duration: 5 3 days Total cycle time: 10 7 days 60 200 mg BChE/kg FW Expression level: 4 20 mg BChE/L culture 3

  4. 4/4/2018 Design Parameters and Assumptions: Downstream 7 Overall Downstream BChE Recovery: 60% Current Projected (Lab Scale, Experimental*) (Manufacturing Scale) Step Step Process Step Process Recovery Recovery Recovery Recovery Crude Extract 100% 100% 100% 100% Clarification 100% 100% 96% 96% UF/DF (TFF) 95% 95% 97% 93% IEX (DEAE) 75% 71% 80% 73% Affinity (Hupresin) 60% 43% 85% 62% UF/DF (TFF) 95% 41% 95% 59% *Corbin JM, et al. 2018. Biotechnology and Bioengineering:1-10. Upstream: Seed Train 8 Each seed train step: • Inoculate at 10 g/L • Grows to 100 g/L over 10 days (τ D = 3 days) • Used to inoculate next step at 10 g/L 4

  5. 4/4/2018 Upstream: Production Reactor 9 4x 20kL production reactors • Grow 4 days (20kL) • Medium exchange (20kL) • Express 3 days (20kL) • Harvest (10kL) • Medium exchange (20kL) • Repeat for 6 months before shutdown, CIP, SIP Downstream: Clarification and Filtration 10 • Extract at 1:3 ratio (biomass to buffer) • Concentrate 10x • Diafilter 4x 5

  6. 4/4/2018 Downstream: Chromatography and Formulation 11 • All chromatography bind and elute • DEAE recovery = 80% • Hupresin recovery = 85% Final product: • 59% Recovery • 95% Purity Economics: CAPEX, OPEX, COGS 12 Annual Operating Cost Parameter Unit Section Base Case Breakdown Upstream 141.6 Consumables CAPEX $ million Downstream 24.4 8% Total 166.0 Laboratory/QC/QA 6% Upstream 2.6 $ OPEX million/ Downstream 32.0 Labor-Dependent year Total 34.6 17% Upstream 115 Raw Materials $/g COGS Downstream 1,432 69% BChE Total 1,547 $620 per 400 mg dose 6

  7. 4/4/2018 Conclusions and Future Work 13  Developed base case model for  Refine costs, process times, manufacturing scale production process parameters of recombinant BChE in  Minimize equipment down transgenic rice cell suspension time culture  Alternate cases Cost per 400  Reactor scheduling BChE Source mg Dose  Clarification equipment >30-fold Human plasma $20,000  Sensitivity analysis reduction in cost Rice cell culture $620  Expression level  Developed tool for future process  Affinity resin binding capacity, design and analysis recovery Acknowledgements References 14 Corbin JM , et al . 2016. Semicontinuous Bioreactor  Production of Recombinant Butyrylcholinesterase in Transgenic Rice Cell Suspension Cultures. Frontiers in Plant Science. 7 :1–9. Corbin JM , et al . 2018. Purification,  characterization, and N-glycosylation of recombinant butyrylcholinesterase from transgenic rice cell suspension cultures. Biotechnology and Bioengineering :1–10. Tusé D, et al . 2014. Manufacturing economics of  plant-made biologics: Case studies in therapeutic and industrial enzymes. Biomed Res. Int. 2014. Nandi S, et al . 2016. Techno-economic analysis of  a transient plant-based platform for monoclonal antibody production. MAbs 8 :0. http://mcdonald-nandi.ech.ucdavis.edu/ 7

Download Presentation
Download Policy: The content available on the website is offered to you 'AS IS' for your personal information and use only. It cannot be commercialized, licensed, or distributed on other websites without prior consent from the author. To download a presentation, simply click this link. If you encounter any difficulties during the download process, it's possible that the publisher has removed the file from their server.

Recommend


More recommend