
SLIDE 1
30/11/2016 1
TEACHING CARTOGRAPHY
The Role of Peer-Assessment
John Lowry presented by Nick Rollings
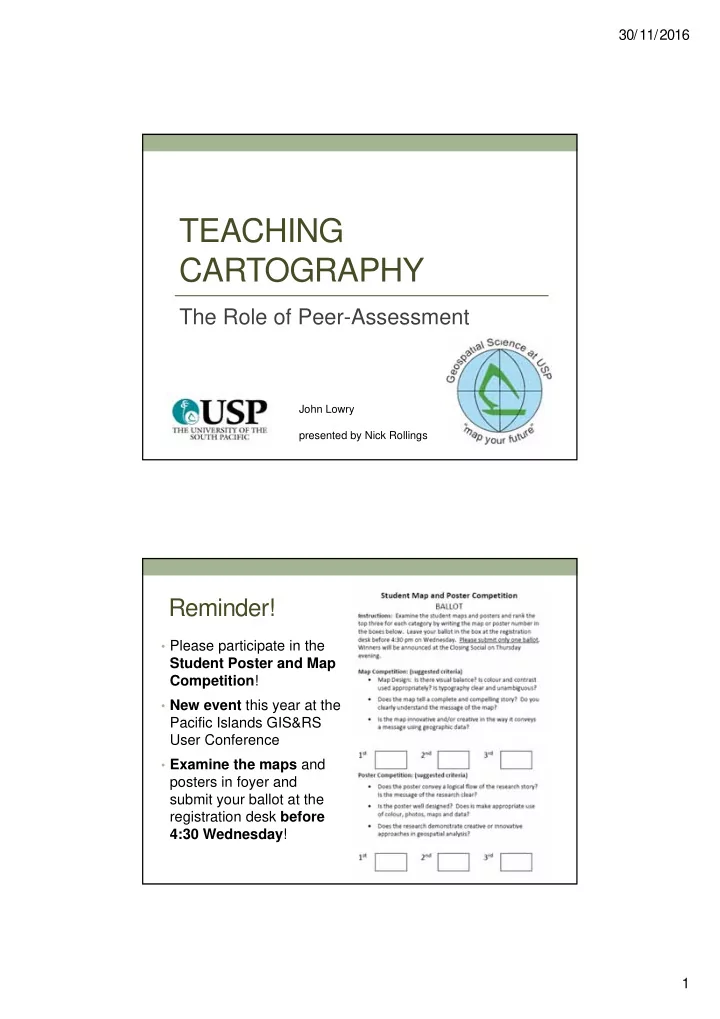
Reminder!
- Please participate in the
Student Poster and Map Competition!
- New event this year at the
Pacific Islands GIS&RS User Conference
- Examine the maps and
posters in foyer and submit your ballot at the registration desk before 4:30 Wednesday!