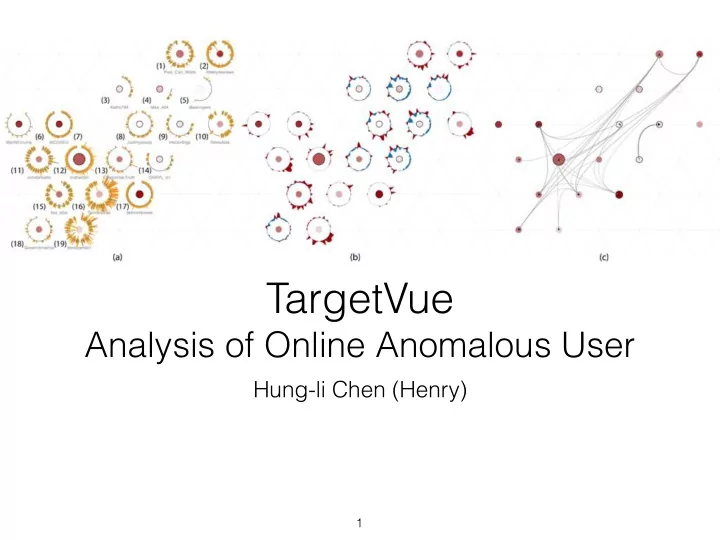
TargetVue Analysis of Online Anomalous User Hung-li Chen (Henry) - - PowerPoint PPT Presentation

targetvue
SMART_READER_LITE
LIVE PREVIEW

TargetVue Analysis of Online Anomalous User Hung-li Chen (Henry) - - PowerPoint PPT Presentation

TargetVue Analysis of Online Anomalous User Hung-li Chen (Henry) 1 Target Vue: Visual Analysis of Anomalous User Behaviours in Online Communication Systems (TVCG, 2016) Nan Cao, Conglei Shi, Sabrina Lin, Jie Lu, Yu-Ru Lin, Ching-Yung


slide-1
SLIDE 1

TargetVue


Analysis of Online Anomalous User

Hung-li Chen (Henry)

1

slide-2
SLIDE 2

Target Vue: Visual Analysis of Anomalous User Behaviours in Online Communication Systems (TVCG, 2016)

Nan Cao, Conglei Shi, Sabrina Lin,
 Jie Lu, Yu-Ru Lin, Ching-Yung Lin First five authors are from IBM T.J. Watson Research Centre The last author is from University of Pittsburgh not Pissburg…

2

slide-3
SLIDE 3

Agenda

  • Context and Contribution
  • Requirements, Data and Tasks
  • Design of TargetVue
  • Evaluation and Comments

3

slide-4
SLIDE 4

Agenda

  • Context and Contribution
  • Requirements, Data and Tasks
  • Design of TargetVue
  • Evaluation and Comments

4

slide-5
SLIDE 5

Context

  • Anomaly Detection is important.
  • Challenging to find completely automated solutions

Contribution

  • TargetVue: a system that detects and supports

interactive exploration of anomalous users

  • New glyph design and the grid layout
  • Evaluation through a bot detection challenge and

case a case study

5

slide-6
SLIDE 6

Agenda

  • Context and Contribution
  • Requirements, Data and Tasks
  • Design of TargetVue
  • Evaluation and Comments

6

slide-7
SLIDE 7

Data Model

  • Initiator - Social Objects - Responders
  • High-level features: Behaviour, Content, Interaction, Temporal,

Network, User Profile

  • Data: time series of feature vectors (for each user)

7

slide-8
SLIDE 8

Requirements

  • 1. Feature Selection
  • 2. Anomaly Detection in Context
  • 3. Ranking Threats
  • 4. Learn from User Feedback

8

slide-9
SLIDE 9

Tasks

  • Showing the data overview and detection results
  • Interpreting user behaviours from different

perspectives

  • Facilitate visual data comparisons
  • Revealing users’ impacts in social communication
  • Easy browsing of raw data
  • Flexible data labeling

9

slide-10
SLIDE 10

Agenda

  • Context and Contribution
  • Requirements, Data and Tasks
  • Design of TargetVue
  • Evaluation and Comments

10

slide-11
SLIDE 11

TargetVue: System Design

11

Time Adaptive Local Outlier Factor Choosing Features

slide-12
SLIDE 12

TargetVue: Interface

12

Global View User List Messages Inspection Feature Variation Propagation

slide-13
SLIDE 13

Global Encodings

  • Users as circular nodes
  • Importance as the size of the nodes
  • Sentiments or anomaly scores as color

13

slide-14
SLIDE 14

Global View

  • Data: dimensionality reduced mean feature vector,

kernel density estimation

  • Encoding: location, contour map (white to blue)
  • Task: overview
  • Outliers are in the low density areas

14

slide-15
SLIDE 15

User list and Messages

  • Data: user profile

information, raw messages

  • Encoding: high frequency

tag cloud, list of messages and user profiles

  • Task: browsing raw data

and overview

15

slide-16
SLIDE 16

Feature Variation and Propagation View

  • Data: derived feature z-score (difference from

baseline), users in communication threads

  • Encoding: temporal heatmap, propogation view

(introduced in FluxFlow)

  • High impact users have many other users in the thread

16

slide-17
SLIDE 17

Inspection: Behaviour Glyph

  • Data: posting and responding activity timeline, duration,

number of users involved, sentiment of the threads

  • Encoding: circular timeline, line mark (see below)
  • line mark: thickness (number of users), length (duration),

color (sentiment), intersection (time when the user join).

17

slide-18
SLIDE 18

Inspection: Z-glyph

  • Data: derived z-score of different features, (based
  • n mean and standard deviation of features)
  • Encoding: baseline circle, color coded area mark

18

slide-19
SLIDE 19

Inspection: Relation glyph

  • Data: interaction relationships between users
  • Encoding: directed links

19

slide-20
SLIDE 20

Inspection: Layout

  • Triangle mesh for placement
  • Fast linear layout
  • Preserve topology
  • Maximize average similarity (clustering) between

neighbouring glyphs

20

slide-21
SLIDE 21

Interaction

21

Query Box Filter (range slider) Highlight Select for Inspection Context Switch Zoom and Pan Data Labeling

slide-22
SLIDE 22

Agenda

  • Context and Contribution
  • Requirements, Data and Tasks
  • Design of TargetVue
  • Evaluation and Comments

22

slide-23
SLIDE 23

Evaluation

  • The investigators used the system in social bot detection

challenge.

  • Use global view to pick out outliers and anomalies
  • Inspect the users, and study their behaviour
  • Inspect specific features of users
  • Tune the model
  • Example usage on Email data.
  • Domain expert interview (2 experts): “Comprehensive”, “very

powerful”

23

slide-24
SLIDE 24

Comments

  • Delivers what are promised (Explicit reference to the

requirements and tasks).

  • Glyph design is information dense, effective for

identifying anomalies, encoding may not be the most visually effective.

  • Scaling limit is unclear (mentioned that the pipeline is

built on hadoop, used the system for twitter data of 8000 users and 4M tweets)

  • Evaluation in the future would be helpful.

24

slide-25
SLIDE 25

Questions?

25