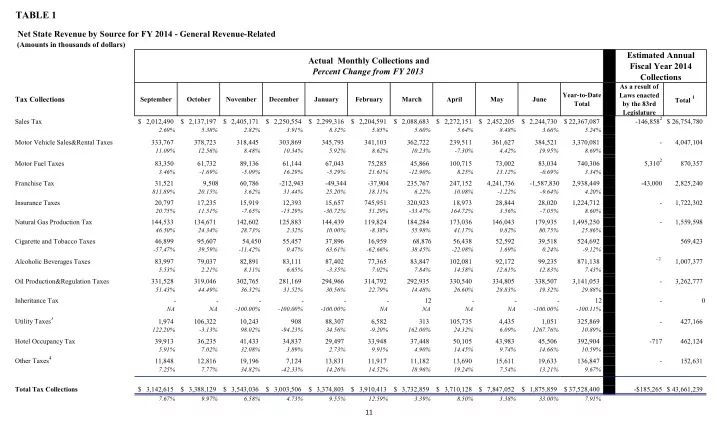
TABLE 1 Net State Revenue by Source for FY 2014 - General - - PowerPoint PPT Presentation

table 1
SMART_READER_LITE
LIVE PREVIEW

TABLE 1 Net State Revenue by Source for FY 2014 - General - - PowerPoint PPT Presentation

TABLE 1 Net State Revenue by Source for FY 2014 - General Revenue-Related (Amounts in thousands of dollars) Estimated Annual Actual Monthly Collections and Fiscal Year 2014 Percent Change from FY 2013 Collections As a result of


slide-1
SLIDE 1

TABLE 1

(Amounts in thousands of dollars) Tax Collections

September October November December January February March April May June Year-to-Date Total As a result of Laws enacted by the 83rd Legislature Total 1 Sales Tax 2,012,490 $ 2,137,197 $ 2,405,171 $ 2,250,554 $ 2,299,316 $ 2,204,591 $ 2,088,683 $ 2,272,151 $ 2,452,205 $ 2,244,730 $ 22,367,087 $

  • 146,8582

26,754,780 $

2.69% 5.38% 2.82% 3.91% 8.32% 5.85% 5.60% 5.64% 8.48% 3.66% 5.24%

Motor Vehicle Sales&Rental Taxes 333,767 378,723 318,445 303,869 345,793 341,103 362,722 239,511 361,627 384,521 3,370,081

  • 4,047,104

11.09% 12.56% 8.48% 10.34% 5.92% 8.62% 10.23%

  • 7.30%

4.42% 19.95% 8.69%

Motor Fuel Taxes 83,350 61,732 89,136 61,144 67,043 75,285 45,866 100,715 73,002 83,034 740,306 5,3102 870,357

3.46%

  • 1.69%
  • 5.09%

16.29%

  • 5.29%

21.61%

  • 12.90%

8.25% 13.12%

  • 0.69%

3.34%

Franchise Tax 31,521 9,508 60,786

  • 212,943
  • 49,344
  • 37,904

235,767 247,152 4,241,736

  • 1,587,830

2,938,449

  • 43,000

2,825,240

811.89% 20.15% 3.62% 31.44% 25.20% 18.11% 6.22% 10.08%

  • 1.22%
  • 9.64%

4.20%

Insurance Taxes 20,797 17,235 15,919 12,393 15,657 745,951 320,923 18,973 28,844 28,020 1,224,712

  • 1,722,302

20.75% 11.51%

  • 7.65%
  • 15.29%
  • 30.72%

51.29%

  • 33.47%

164.72% 3.56%

  • 7.05%

8.60%

Natural Gas Production Tax 144,533 134,671 142,602 125,883 144,439 119,824 184,284 173,036 146,043 179,935 1,495,250

  • 1,559,598

46.50% 24.34% 28.73% 2.32% 10.00%

  • 8.38%

55.98% 41.17% 0.82% 80.75% 25.86%

Cigarette and Tobacco Taxes 46,899 95,607 54,450 55,457 37,896 16,959 68,876 56,438 52,592 39,518 524,692 569,423

  • 57.47%

39.59%

  • 11.42%

0.47% 63.61%

  • 62.66%

38.45%

  • 22.08%

1.69% 0.24%

  • 9.12%

Alcoholic Beverages Taxes 83,997 79,037 82,891 83,111 87,402 77,365 83,847 102,081 92,172 99,235 871,138

  • 2

1,007,377

5.53% 2.21% 8.11% 6.65%

  • 3.35%

7.02% 7.84% 14.58% 12.61% 12.83% 7.43%

Oil Production&Regulation Taxes 331,528 319,046 302,765 281,169 294,966 314,792 292,935 330,540 334,805 338,507 3,141,053

  • 3,262,777

51.43% 44.49% 36.32% 31.52% 30.56% 22.79% 14.48% 26.60% 28.83% 19.32% 29.88%

Inheritance Tax

  • 12
  • 12
  • NA

NA

  • 100.00%
  • 100.00%
  • 100.00%

NA NA NA NA

  • 100.00%
  • 100.11%

Utility Taxes3 1,974 106,322 10,243 908 88,307 6,582 313 105,735 4,435 1,051 325,869

  • 427,166

122.20%

  • 3.13%

98.02%

  • 94.23%

34.56%

  • 9.20%

162.00% 24.32% 6.09% 1267.76% 10.89%

Hotel Occupancy Tax 39,913 36,235 41,433 34,837 29,497 33,948 37,448 50,105 43,983 45,506 392,904

  • 717

462,124

5.91% 7.02% 32.08% 3.89% 2.73% 9.91% 4.90% 14.45% 9.74% 14.66% 10.59%

Other Taxes4 11,848 12,816 19,196 7,124 13,831 11,917 11,182 13,690 15,611 19,633 136,847

  • 152,631

7.25% 7.77% 34.82%

  • 42.33%

14.26% 14.52% 18.96% 19.24% 7.54% 13.21% 9.67%

Total Tax Collections 3,142,615 $ 3,388,129 $ 3,543,036 $ 3,003,506 $ 3,374,803 $ 3,910,413 $ 3,732,859 $ 3,710,128 $ 7,847,052 $ 1,875,859 $ 37,528,400 $

  • $185,265

43,661,239 $

7.67% 9.97% 6.58% 4.73% 9.55% 12.59% 3.39% 8.50% 3.38% 33.00% 7.91%

11

Estimated Annual Fiscal Year 2014 Collections Net State Revenue by Source for FY 2014 - General Revenue-Related Actual Monthly Collections and Percent Change from FY 2013

slide-2
SLIDE 2

TABLE 1 (continued)

(Amounts in thousands of dollars) Revenue By Source

September October November December January February March April May June Year-to-Date Total As a result of Laws enacted by the 83rd Legislature Total 1 Total Tax Collections 3,142,615 $ 3,388,129 $ 3,543,036 $ 3,003,506 $ 3,374,803 $ 3,910,413 $ 3,732,859 $ 3,710,128 $ 7,847,052 $ 1,875,859 $ 37,528,400 $

  • $185,265

43,661,239 $

7.67% 9.97% 6.58% 4.73% 9.55% 12.59% 3.39% 8.50% 3.38% 33.00% 7.91%

Licenses,Fees,Permits,Fines&Penalties 88,369 118,699 119,205 96,494 175,371 151,355 122,846 119,729 133,763 98,840 1,224,671 105,645 1,328,477

35.41% 64.62% 22.93% 31.79% 10.82% 31.46% 31.12% 37.72% 29.96% 27.33% 29.99%

Interest and Investment Income 5,444 141,350 70,323 70,388 72,744 68,585 73,112 71,064 71,152 70,502 714,666 12,787 833,490

43.67% 5377.95%

  • 72.03%
  • 13.17%
  • 9.47%
  • 69.71%
  • 19.75%
  • 13.95%
  • 15.87%
  • 68.92%
  • 36.79%

Lottery Proceeds 119,961 85,072 83,539 81,100 106,182 80,184 93,411 96,407 90,424 110,209 946,489

  • 1,035,518

2840.54% 9.19% 11.19%

  • 12.85%

9.84% 7.05% 16.34% 2.63% 1.28%

  • 16.66%

15.78%

Sales of Goods and Services 9,976 11,025 9,054 6,604 12,872 9,560 9,547 12,327 8,984 9,136 99,084

  • 117,314

18.67% 35.15%

  • 2.96%
  • 14.58%

25.75%

  • 12.84%

1.33% 34.20%

  • 4.90%
  • 17.26%

5.49%

Settlements of Claims 916 1,947 11,014 467,537 2,788 18,009 1,324 37,085 6,161 437 547,218

  • 529,158
  • 14.25%

71.35% 1896.08%

  • 0.34%
  • 598.89%

946.50% 26.70% 148.22%

  • 92.62%

141.58%

  • 4.45%

Land Income 2,947 4,594 2,789 3,439 4,091 4,382 2,690 3,186 4,468 4,013 36,599

  • 14,055

48.43% 94.10% 36.28%

  • 17.14%

58.28% 51.45%

  • 23.95%
  • 37.60%

31.74% 13.19% 15.79%

Contributions to Employee Benefits 7 8 8 8 8 7 13 5 6 6 76

  • 112
  • 27.14%
  • 10.73%
  • 10.56%
  • 10.57%
  • 11.41%

409.41% 101.73%

  • 23.70%
  • 15.51%
  • 15.51%

3.46%

Other Revenue Sources 101,627 191,017 58,265 83,176 178,541 33,907 195,411 198,450 60,215 284,555 1,385,164 26,402 1,713,024

64.11%

  • 66.35%
  • 73.90%

12.47% 1.66%

  • 38.32%

199.83%

  • 30.13%
  • 369.66%

24.06%

  • 19.17%

Total Net Revenue 3,471,861 $ 3,941,842 $ 3,897,233 $ 3,812,252 $ 3,927,400 $ 4,276,402 $ 4,231,214 $ 4,248,382 $ 8,222,224 $ 2,453,556 $ 42,482,367 $

  • $40,431

49,232,387 $

13.27% 3.38%

  • 2.16%

3.87% 8.98% 7.99% 6.99% 6.31% 3.54% 17.32% 6.00%

Note: Totals may not sum because of rounding. SOURCE: Susan Combs, Texas Comptroller of Public Accounts.

12

Actual Monthly Collections and Percent Change from FY 2013 Estimated Annual Fiscal Year 2014 Collections

4 - Includes the cement and sulphur taxes and other occupation and gross receipt taxes not separately identified.

Net State Revenue by Source for FY 2014 - General Revenue-Related

3 - Includes public utility gross receipts assessment; gas, electric and water utility tax; and gas utility pipeline tax. 1 -From the December 2013 Certification Revenue Estimate. Includes the impact of laws enacted by the 83rd Legislature. 2 -Values do not include SB 559 which reversed the speed-up of some tax collections, as well as the delay of motor fuel allocations. The repeal of the above actions

  • ccurred prior to any implementation such that the overall pattern of collections/allocations remained unchanged.
slide-3
SLIDE 3

TABLE 2

(Amounts in thousands of dollars) Tax Collections

September October November December January February March April May June Year-to-Date Total As a result of Laws enacted by the 83rd Legislature Total 1 Sales Tax 2,020,269 $ 2,145,817 $ 2,412,279 $ 2,257,478 $ 2,311,811 $ 2,213,237 $ 2,098,297 $ 2,283,607 $ 2,461,518 $ 2,254,355 $ 22,458,667 $

  • 143,1682

26,840,354 $

2.75% 5.36% 2.81% 3.90% 8.36% 5.83% 5.63% 5.64% 8.51%

3.71%

5.26%

Motor Vehicle Sales&Rental Taxes 335,352 381,415 321,532 306,417 348,514 344,448 365,698 242,611 363,977 387,758 3,397,721

  • 4,084,004

10.62% 12.48% 8.48% 10.19% 5.93% 8.67% 10.40%

  • 7.19%

4.36% 19.80% 8.63%

Motor Fuel Taxes 283,937 262,862 281,793 267,933 263,598 268,866 253,715 286,763 283,503 291,111 2,744,081 20,6032 3,243,100

2.08% 1.21% 0.19% 3.42%

  • 0.12%

5.26% 5.77% 1.69% 4.42% 2.94% 2.63%

Franchise Tax 31,521 9,508 60,786

  • 212,943
  • 49,344
  • 37,904

235,767 247,152 4,241,736 50,544 4,576,823

  • 341,902

4,666,571

385.79% 20.15% 3.62% 31.44% 25.20% 18.11% 6.22% 10.08%

  • 1.22%

119.24%

  • 0.57%

Insurance Taxes 20,830 17,235 15,919 12,730 15,689 745,951 320,923 18,973 29,187 28,064 1,225,501

  • 1,723,659

20.73% 9.35%

  • 8.18%
  • 13.07%
  • 30.68%

51.29%

  • 33.46%

164.72% 3.20%

  • 7.07%

8.59%

Natural Gas Production Tax 144,533 134,671 142,602 125,883 144,439 119,824 184,284 173,036 146,043 179,935 1,495,250

  • 1,559,598

46.50% 24.34% 28.73% 2.32% 10.00%

  • 8.38%

55.98% 41.17% 0.82% 80.75% 25.86%

Cigarette and Tobacco Taxes 46,899 116,529 123,374 131,402 114,197 83,852 117,043 126,803 127,049 117,730 1,104,878

  • 1,399,301
  • 58.06%
  • 15.51%
  • 11.68%
  • 5.22%

7.55%

  • 21.99%

3.20%

  • 11.18%
  • 6.15%
  • 2.50%
  • 11.89%

Alcoholic Beverages Taxes 83,997 79,037 82,891 83,111 87,402 77,365 83,847 102,081 92,172 99,235 871,138

  • 2

1,007,737

5.53% 2.21% 8.11% 6.65%

  • 3.35%

7.02% 7.84% 14.58% 12.61% 12.83% 7.43%

Oil Production&Regulation Taxes 331,528 319,046 302,765 281,169 294,966 314,792 292,935 330,540 334,805 338,507 3,141,053

  • 3,262,777

51.43% 44.49% 36.32% 31.52% 30.56% 22.79% 14.48% 26.60% 28.83% 19.32% 29.88%

Inheritance Tax

  • 12
  • 12
  • N/A

N/A

  • 100.00%
  • 100.00%
  • 100.00%

N/A N/A N/A N/A

  • 100.00%
  • 100.11%

Utility Taxes3 1,974 106,322 10,243 908 88,307 6,582 313 105,735 4,435 1,051 325,869

  • 427,166

122.20%

  • 3.13%

98.02%

  • 94.23%

34.56%

  • 9.20%

162.00% 24.32% 6.09% 1267.76% 10.89%

Hotel Occupancy Tax 39,913 36,235 41,433 34,837 29,497 33,948 37,448 50,105 43,983 45,506 392,904

  • 717

462,124

5.91% 7.02% 32.08% 3.89% 2.73% 9.91% 4.90% 14.45% 9.74% 14.66% 10.59%

Other Taxes4 12,189 20,698 22,374 7,453 20,569 14,908 11,521 59,045 24,311 25,667 218,735

  • 237,001

7.06% 6.60% 28.84%

  • 40.90%

14.95% 2.78% 18.34% 9.67%

  • 19.64%

41.72% 6.64%

Total Tax Collections 3,352,940 $ 3,629,373 $ 3,817,989 $ 3,296,377 $ 3,669,647 $ 4,185,869 $ 4,001,804 $ 4,026,451 $ 8,152,719 $ 3,819,463 $ 41,952,632 $

  • $465,184

48,913,392 $

7.11% 7.81% 5.96% 4.07% 8.71% 11.79% 3.34% 7.81% 3.10% 9.65% 6.52%

13

Net State Revenue by Source for FY 2014 - All Funds Excluding Trust Actual Monthly Collections and Percent Change from FY 2013 Estimated Annual Fiscal Year 2014 Collections

slide-4
SLIDE 4

TABLE 2 (continued)

Net State Revenue by Source for FY 2014 - All Funds Excluding Trust

(Amounts in thousands of dollars) Revenue By Source

September October November December January February March April May June Year-to-Date Total As a result of Laws enacted by the 83rd Legislature Total 1 Total Tax Collections 3,352,940 $ 3,629,373 $ 3,817,989 $ 3,296,377 $ 3,669,647 $ 4,185,869 $ 4,001,804 $ 4,026,451 $ 8,152,719 $ 3,819,463 $ 41,952,632 $

  • $465,184

48,913,392 $

7.11% 7.81% 5.96% 4.07% 8.71% 11.79% 3.34% 7.81% 3.10% 9.65% 6.52%

Federal Income 2,471,524 3,287,155 2,782,221 2,792,850 3,020,161 2,509,987 2,671,105 2,511,233 2,609,034 4,273,376 28,928,645

  • 35,902,617
  • 7.64%

16.04% 1.16% 3.58% 27.98% 4.84% 5.00% 1.00%

  • 7.43%

27.95%

7.55%

Licenses, Fees, Permits,Fines&Penalties 572,443 930,003 494,452 762,695 1,117,589 459,322 421,647 477,496 514,792 1,347,211 7,097,650

  • 127,727

8,293,902

  • 24.94%

34.38%

  • 22.60%

118.67% 71.66%

  • 0.21%
  • 4.93%
  • 21.61%
  • 54.59%

172.83% 13.86%

Interest and Investment Income 213,426 134,910 73,846 95,886 87,875 85,690 140,469 84,366 78,095 77,031 1,071,595

  • 1,084,043
  • 12.35%

18.99%

  • 26.59%

16.13% 19.35% 0.37% 58.83%

  • 51.61%

0.39% 298.54% 1.19%

Lottery Proceeds 148,351 173,172 138,371 173,450 168,578 169,434 164,104 176,130 139,044 136,884 1,587,518

  • 1,573,034

11.51% 10.64%

  • 4.63%

1.19% 2.31% 13.86% 0.61% 24.16%

  • 36.65%

5.01% 0.83%

Sales of Goods and Services 19,251 21,797 16,674 17,299 24,028 20,853 23,090 26,668 21,530 24,580 215,769

  • 380,932

13.15% 34.02% 3.30% 14.93% 14.99%

  • 1.78%

7.62% 26.83% 17.51% 23.75% 15.22%

Settlements of Claims 2,590 4,287 12,473 469,339 5,092 20,398 2,578 38,578 7,722 1,820 564,879

  • 538,524

33.54%

  • 30.41%

514.36%

  • 0.34%

268.73% 496.24% 16.81% 123.36%

  • 90.98%
  • 25.65%
  • 4.81%

Land Income 238,786 116,473 146,948 145,763 104,347 137,499 182,342 172,308 135,288 147,736 1,527,491

  • 1,174,006

98.74% 22.99% 84.56% 6.63% 101.53% 51.59% 83.39%

  • 4.49%

17.42% 41.42% 42.33%

Contributions to Employee Benefits 7 8 14 2 8 7 13 5 6 6 76

  • 112
  • 27.58%
  • 10.73%

56.68%

  • 77.81%
  • 11.41%

409.41% 101.73%

  • 23.70%
  • 15.51%
  • 15.51%

3.40%

Other Revenue Sources 480,585 470,909 93,060 154,835 441,748 350,649 307,559 827,549 420,242 569,407 4,116,544

  • 4,649,762

127.69%

  • 47.12%
  • 72.23%
  • 26.21%

2.61% 14.97%

  • 5.09%

34.46% 55.34% 12.33% 0.43%

Total Net Revenue 7,499,903 $ 8,768,089 $ 7,576,048 $ 7,908,497 $ 8,639,072 $ 7,939,709 $ 7,914,713 $ 8,340,784 $ 12,078,471 $ 10,397,513 $ 87,062,800 $

  • $592,911

102,510,324 $

2.80% 7.33%

  • 1.24%

8.35% 21.17% 9.47% 4.71% 4.51%

  • 4.49%

28.36% 7.35%

Note: Totals may not sum because of rounding. SOURCE: Susan Combs, Texas Comptroller of Public Accounts.

14

4 - Includes the cement and sulphur taxes and other occupation and gross receipt taxes not separately identified.

Actual Monthly Collections and Percent Change from FY 2013 Estimated Annual Fiscal Year 2014 Collections

1 -From the December 2013 Certification Revenue Estimate. Includes the impact of laws enacted by the 83rd Legislature. 3 - Includes public utility gross receipts assessment; gas, electric and water utility tax; and gas utility pipeline tax. 2 - Values do not include SB 559 which reversed the speed-up of some tax collections, as well as the delay of motor fuel allocations. The repeal of the above actions occurred prior to any implementation such that the overall pattern of collections/allocations remained unchanged.