
SLIDE 1
Presentation to: Quabbin Regional School Committee Wednesday, January 11, 2017
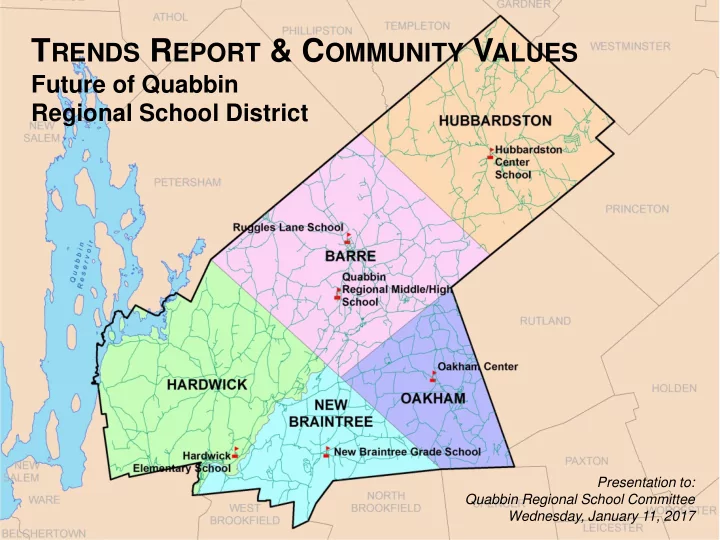
T RENDS R EPORT & C OMMUNITY V ALUES Future of Quabbin Regional - - PowerPoint PPT Presentation
T RENDS R EPORT & C OMMUNITY V ALUES Future of Quabbin Regional School District Presentation to: Quabbin Regional School Committee Wednesday, January 11, 2017 Agenda About the Center & Project Team Trends Report Preliminary
Presentation to: Quabbin Regional School Committee Wednesday, January 11, 2017
How do we provide schools with the solid foundation needed to provide a quality education?
Population by Town (1980-2010) Year Barre Hardwick Hubbardston New Braintree Oakham Total 1980 4,102 2,272 1,797 671 994 9,836 1990 4,546 2,385 2,797 881 1,503 12,112 2000 5,113 2,622 3,909 927 1,673 14,244 2010 5,398 2,990 4,382 999 1,902 15,671 % Change 1980-2010 32% 32% 144% 49% 91% 59%
Source: U.S. Census Bureau, Decennial Census
Residents in Labor Force by Town (1990-2015) 1990 1995 2000 2005 2010 2015 Change (1990-2015) Barre 2,328 2,390 2,676 2,794 2,901 2,922 26% Hardwick 1,166 1,172 1,330 1,336 1,600 1,649 41% Hubbardston 1,515 1,667 2,238 2,443 2,441 2,488 64% New Braintree 463 450 542 644 550 551 19% Oakham 784 840 956 1,078 1,080 1,102 41%
Source: Massachusetts Department of Labor.
Number of Businesses and Employees by Town (2004 and 2014) # of businesses # of employees 2004 2014 Change 2004 2014 Change Barre 113 107
1,070 968
Hardwick 48 36
347 452 105 Hubbardston 66 54
401 262
New Braintree 16 19 3 43 60 17 Oakham 25 29 4 91 72
Total 268 245
1,952 1,813
Source: US. Census, Zip Code Business Patterns
Local cost of living is 21% below state average.
Note: Enrollment numbers are as of October 1st of prior calendar year.
Numbers of School-Attending Residents in Study Area (2000-2016) 2000 2005 2010 2016 Change 2000- 2016 % Change In-District Public Schools 2,784 2,896 2,498 1,992
Voc/Tech Regional Schools 93 94 115 152 59 63% Charter Schools NA NA NA 27 NA NA Out-of-District Public Schools 150* 58* 77* 65
Home Schooled NA NA NA 74 NA NA Private and Parochial Schools 80* 187* 173* 68
Collaboratives 1 16 9 16 15 1,500% All non-district 324 355 374 402 78 24% Total School-Attending Residents 3,108 3,251 2,872 2,394
Source: Massachusetts Department of Elementary and Secondary Education.
*Note: Charter and Homeschooled students were enumerated separately by DESE beginning in 2011. Prior to this, these students were included in counts of students attending Private and Out-of-District schools. Counts are as of October of the prior calendar year.
Note: Enrollment numbers are as of October 1st of prior calendar year.
Special Needs Populations versus State Average (2012-2016) 2012 2013 2014 2015 2016 State (2016) Total Enrollment 2,717 2,589 2,486 2,462 2,395 953,429 Economic disadvantage
23% 27% Students with disabilities 15% 15% 17% 17% 19% 17% English language learners
First language not English
19%
Source: Massachusetts Department of Elementary and Secondary Education
Two percentage point difference translates into 49 more students with IEPs in QRSD above the state average. Note: Enrollment numbers are as of October 1st of prior calendar year.
State Ratings of QRSD Schools Year Ruggles Lane Hardwick Elementary Hubbardston Center Oakham Center High School Middle School 2014 Level 2 2 2 1 2 2 Percentile 33 44 66 73 62 52 2015 Level 2 2 2 2 2 2 Percentile 36 39 64 70 53 49 2016 Level 2 2 2 2 2 2 Percentile 41 35 63 65 41 45
Source: Massachusetts Department of Elementary and Secondary Education.
Distribution of Massachusetts Schools by Accountability Rating (2016) Rating Level 1 Level 2 Level 3 Level 4 Level 5 Total # of schools 525 794 265 33 4 1,621 % evaluated 32.4% 49.0% 16.3% 2.0% 0.2%
Source: Massachusetts Department of Elementary and Secondary Education..
Note: New Braintree Elementary (along with 232 other schools) were not rated due to insufficient data
ELA Science/Tech Math
Per Pupil Spending (2013-2015) QRSD State 2013 2014 2015 2013 2014 2015 FTE Pupils In-district 2,559 2,481 2,445 918,545 917,204 913,268 Out-of-district 137 140 159 63,163 65,266 69,736 All pupils 2,696 2,621 2,604 981,708 982,469 983,004 Expenditures Per in-district pupil $12,380 $12,800 $13,330 $13,509 $13,997 $14,440 Per out-of-dist pupil $24,623 $24,983 $23,625 $21,500 $21,839 $21,532 Per pupil $13,003 $13,452 $13,957 $14,023 $14,518 $14,943
Massachusetts Department of Elementary and Secondary Education
Per Pupil Spending by Type (2015) Expenditure Types QRSD State Difference Amount Percent Administration $582 $531 $51 9.5% Instr Leadership $729 $976
Teachers $4,740 $5,620
Other Teaching Svcs $1,066 $1,176
Prof Devt $428 $197 $231 116.9% Instr Matl/Equip/Tech $469 $432 $37 8.6% Guid, Counsel, Test $359 $442
Pupil Services $1,643 $1,430 $212 14.8% Op and Maintenance $1,312 $1,144 $168 14.6% Benefits and fixed chgs $2,003 $2,490
Massachusetts Department of Elementary and Secondary Education
Per Pupil Spending on Teachers (2013-2015) QRSD State 2015 Difference Expenditure Types 2013 2014 2015 2013 2014 2015 Amt Pct Teachers $4,692 $4,660 $4,740 $5,291 $5,441 $5,620
Teachers, Class $4,517 $4,513 $4,457 $4,730 $4,833 $5,011
Teachers, Specials $174 $147 $284 $561 $608 $609
Student/teacher 14.2 :1 14.4 :1 14.7 :1 13.5 :1 13.6 :1 13.3 :1 1.4:1 10.8% Teacher avg salary 68,603 69,815 72,643 71,983 73,847 74,703 -2,060
average.
Facility Size and Age Name Year Built Re- novated SF Class- rooms Enrollment 10/2009 10/2016 Ruggles Lane (Barre) 1953 1988 72,470 30 478 368 Hardwick Elementary 1992 N/A 44,125 15 269 194 Hubbardston Center 1954 1990 64,740 22 434 316 New Braintree Grade 1997 N/A 27,750 9 76 108 Oakham Center 1976 1990 46,000 21 291 149 Quabbin Middle School 1997 N/A 39,361 36 494 424 Quabbin High School 1997 N/A 77,289 60 970 689 TOTAL 371,735 3,012 2,248
QRSD SPACE NEEDS BY SQUARE FOOT PER STUDENT Square Footage 10/2016 Enrollment MSBA sf/student SF needed (MSBA) SF above standard Diff % Ruggles Lane (Barre) 72,470 368 172 63,296 9,174 114.5% Hardwick Elem 44,125 194 180 34,920 9,205 126.4% Hubbardston Center 64,740 316 179 56,564 8,176 114.5% New Braintree 27,750 108 180 19,440 8,310 142.7% Oakham Center 46,000 149 180 26,820 19,180 171.5% Middle School 82,957 424 188 79,712 3,245 104.1% High School 162,893 689 216 148,824 14,069 109.5% TOTAL 500,935 2,248 429,576 71,359 116.6%
ABOVE AVERAGE SF TO CLASSROOMS CONVERSION SF per Classroom (MSBA) Space above Average Classrooms Above Avg (Est.) Elementary 900 54,045 60 Middle 850 3,245 4 High 850 14,069 17 71,359 81
QRSD SPACE NEEDS BY STUDENTS:CLASSROOMS RATIO 10/2016 Enrollment # Class- rooms MSBA student/ classrm Classrm needed (MSBA) # classrms above standard Diff % Ruggles Lane (Barre) 368 30 23 16.0 14.0 188% Hardwick Elem 194 15 23 8.4 6.6 179% Hubbardston Center 316 22 23 13.7 8.3 161% New Braintree 108 9 23 4.7 4.3 191% Oakham Center 149 21 23 6.5 14.5 323% Middle School 424 35 23 18.4 16.6 190% High School 689 60 23 30.0 30.0 200% TOTAL 2,248 192 97.7 94.3 197%
Town Assessments (FY2012 and FY2017) FY2012 FY2017 Dollar Change Percent Change Barre $4,215,708 $5,213,612 $997,904 24% Hardwick $2,012,529 $2,370,321 $357,792 18% Hubbardston $3,488,762 $4,332,544 $843,782 24% New Braintree $1,043,905 $1,213,526 $169,622 16% Oakham $1,537,870 $2,064,774 $526,904 34% Total $12,298,774 $15,194,778 $2,896,004 24%
Source: Massachusetts DOR
Quabbin FY2017 Projected Revenue Budget State Funding Revenues % of Total Chapter 70 Aid 16,463,038 Charter Reimburse 28,576 Transportation Aid 871,623 Sub-total 17,363,237 52.71% Local Funding Barre 5,213,612 Hardwick 2,370,321 Hubbardston 4,332,544 New Braintree 1,213,526 Oakham 2,064,774 Sub-total 15,194,778 46.13% District Funding Excess and Deficiency 50,000 Medicaid 212,000 Pre-K tuition fees 45,623 NJROTC 74,000 Sub-total 381,623 1.16% TOTAL Budget 32,939,638
Changes in State Aid FY2009 – FY2017 FY2009 FY2017 Dollar Change Percent Change Barre $1,158,319 $1,052,998
Hardwick $561,462 $560,644
Hubbardston $603,604 $537,758
New Braintree $210,539 $186,833
Oakham $377,927 $281,590
Total $2,911,851 $2,619,823
Source: Massachusetts DOR
Note: This table is value of property, not actual budget dollars. Local tax rate(s) influence the amount of revenue generated.
Changes in Assessed Valuation FY2007-FY2016 FY2007 Total Assessed Values FY2016 Total Assessed Values Dollar Change Percent Change Barre $474,526,461 $400,479,913
Hardwick $263,380,887 $226,213,700
Hubbardston $488,635,274 $395,563,065
New Braintree $113,029,238 $105,051,471
Oakham $213,378,581 $190,647,859
Total $1,552,950,441 $1,317,956,008 -$234,994,433
Source: Massachusetts DOR
Revenue from New Growth (10-Year Average) Barre $130,547 Hardwick $42,920 Hubbardston $86,691 New Braintree $24,782 Oakham $28,383 Total $313,322
Source: Massachusetts DOR
Residential vs Commercial/Industrial Share of Property Value (2016) Residential Commercial / Industrial Barre 84.0% 16.0% Hardwick 90.7% 9.3% Hubbardston 93.4% 6.6% New Braintree 94.3% 5.7% Oakham 92.8% 7.2%
Source: Massachusetts Department of Revenue
School Spending as Percent of FY2017 Budget QRSD Assessment Vocational Assessment Total Education Gen Fund Budget Education Percentage Barre 5,213,612 257,393 5,471,005 10,802,512 50.65% Hardwick 2,370,321 260,006 2,630,327 4,860,941 54.11% Hubbardston 4,334,632 610,127 4,944,759 8,212,824 60.21% New Braintree 1,213,526 154,387 1,367,913 2,243,215 60.98% Oakham 1,964,739 198,199 2,162,938 3,563,276 60.70%
towards important goals
priorities
“Given the fact that hard decisions will have to be made, what do we Value? How might those values guide us?” “What Creative Ideas do we have to strengthen the District financially and help students get a great education?”
Curriculum and offerings:
improve district ranking”
woodworking-and keep students here” Educational outcomes:
Community values:
Financial innovations and concerns:
Teaching:
involvement”
Initial tabulations were based on transcripts of actual participant comments, grouped into initial categories on the basis of similarity in statements
Aggregation was done by answering the question, “Achieving (this value) could enable us to achieve what more ‘fundamental’ value?”
This begins to link specific actions to specific values
Values Conversation
Improve educational
(Max) [quality of] curriculum and
Maximize school district’s contribution to community well-being (Max) Educational
Maximize school and community values (25) (Max) Community values (10) (Max) Educational values (13) (Max) Family connections (2) Maximize district reputation (12) (Max) Marketing and programmatic innovations (8) (Max) Community impacts (2) Maximize in-school experience (8) (Max) [quality
environment (2) (Max) [quality of] Teaching (2) (Max) [level
(Max) [quality of services to] Special needs [students] (1) (Max) [quality
activities (1) Maximize financial sustainability of district (22) (Max) Financial innovations [to meet] community concerns (13) (Max) Physical infrastructure and alternative building uses (8)
Potential performance metrics can be identified (not all in dollars)
Maximize school district’s contribution to community well- being To students Educational
To community To educators To district Safety District reputation Perceived support for community values Class size Curriculum quality Teacher quality Variety in facility uses Student diversity Teacher engagement with community
How can the District choose which recommendations to put into practice?
To be filled in based on actual recommendations