System Structure Department of Developmental Services Mission - - PowerPoint PPT Presentation

system structure department of developmental services
SMART_READER_LITE
LIVE PREVIEW

System Structure Department of Developmental Services Mission - - PowerPoint PPT Presentation

The Lanterman Developmental Disabilities Services Act (Lanterman Act) Update on Californias Developmental Disabilities System The Lanterman Developmental Disabilities Services Act passed in 1969. This California law states that people with


slide-1
SLIDE 1

Update on California’s Developmental Disabilities System

UCSF Presentation March 2, 2017

Nancy Bargmann, Director California Department of Developmental Services Sacramento, CA

The Lanterman Developmental Disabilities Services Act (Lanterman Act)

The Lanterman Developmental Disabilities Services Act passed in 1969. This California law states that people with developmental disabilities and their families have a right to get the services and supports needed to live like people without disabilities. Last year marked the 50th Anniversary of Supporting Consumers in the Community.

Department of Developmental Services

The Department of Developmental Services (DDS) is committed to providing leadership that results in quality services to the people of California and assures the

  • pportunity for individuals with developmental disabilities to

exercise their right to make choices

Mission Vision

“Building Partnerships, Supporting Choices”
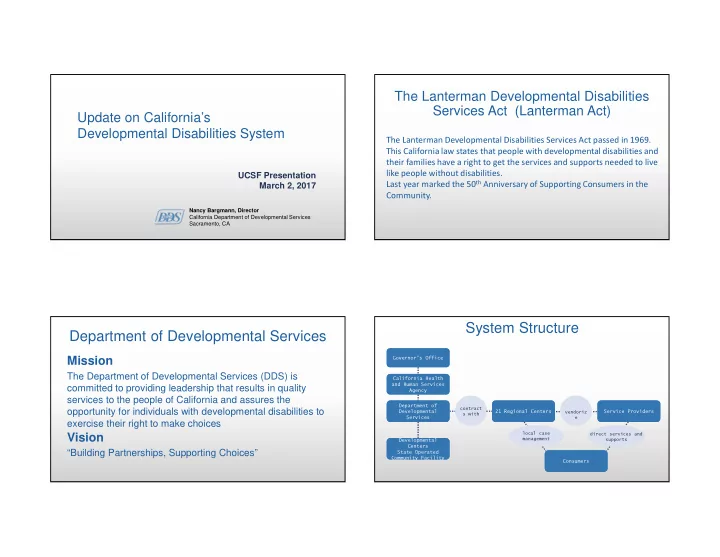
System Structure

contract s with vendoriz e local case management direct services and supports Governor’s Office Governor’s Office California Health and Human Services Agency California Health and Human Services Agency Department of Developmental Services Department of Developmental Services Consumers Consumers Service Providers Service Providers 21 Regional Centers 21 Regional Centers Developmental Centers State Operated Community Facility Developmental Centers State Operated Community Facility

slide-2
SLIDE 2
  • DDS contracts with 21 regional centers (RCs) throughout California

to serve over 300,000 individuals who have a developmental disability (consumers)

  • RCs work with approximately 45,000 vendors who provide direct

services and supports to consumers

  • We work with a system of partners (other organizations,

stakeholder groups, individuals and families) to implement the vision of the Lanterman Act

System Structure

Consumer Population

183,000 214,000 249,500 304,000

2002 2006 2011 2016

As of December 2016

  • 5,000

10,000 15,000 20,000 25,000 30,000 35,000

Average 14,400 Inland 31,300 Redwood Coast 3,600

Regional Center Consumer Population

As of December 2016

Consumer Population by Age

2011 2016 2006

12% 38% 8% 36% 7% 12% 37% 8% 34% 8% 11% 36% 9% 34% 10% 13% 36% 9% 33% 10%

Infants (0 to 2) Children (3 to 17) Young Adults (18 to 21) Adults (22 to 51) Seniors (52 and Older)

2002

As of December 2016

slide-3
SLIDE 3

2011 2016 2006

78% 10% 8% 2% 0.6% 0.4% 0.3% 75% 11% 9% 3% 0.6% 0.5% 0.7% 73% 12% 9% 3% 0.7% 0.7% 1.3%

Home of Parent/Guardian Community Care Independent Living Intermediate Care Facility Other Skilled Nursing Facility Developmental Center

As of December 2016

Consumer Population by Living Arrangement Consumer Population by Diagnosis*

2011 2016 2006

* A consumer is counted under multiple categories if he/she has more than one diagnosis 18% 18% 20% 69% 10% 25% 16% 17% 62% 11% 34% 14% 15% 55% 10%

Autism Cerebral Palsy Epilepsy Intellectual Disability Other

As of December 2016

Population of Developmental Centers and State-Operated Community Facilities

DDS Proposed Budget

FY 16/17 – Updated- Proposed

  • Community Services

$ 5.8 bil

  • Developmental Centers

$ 0.5 bil

  • Headquarters Support

$ 0.1 bil

  • Total DDS

$ 6.4 bil

FY 17/18 – Proposed

  • Community Services

$ 6.4 bil

  • Developmental Centers

$ 0.4 bil

  • Headquarters Support

$ 0.1 bil

  • Total DDS

$ 6.9 bil

slide-4
SLIDE 4

Federal Funding

General/State Funds $ 3,561,875 Medicaid Reimbursements $ 2,235,910 Other Federal Funds $ 214,233 Early Start/Part C Grant $ 52,895 Total $ 6,064,913

* Values in thousands

59% 37% 3% 1%

Regional Center Funding for FY 2016-17

(per 2017-18 Governor's Proposed Budget)

General/State Funds Medicaid Reimbursements Other Federal Funds Early Start/Part C Grant

General Fund (GF) is the main operating fund of the state. Medicaid Reimbursements provide funding for services and activities such as:

  • Services for eligible individuals who live in their communities.
  • Regional Center activities such as Case Management
  • Administrative Functions associated with Medicaid programs.

Other Federal Funds:

  • Funds services and activities to support individuals who live in

their communities.

Asian, 13% Black/Africa n American, 6% Hispanic/Lat ino, 38% Native American, 1% Other, 3% Pacific Islander, 0% White, 40%

California's Population by Ethnicity

Asian, 9% Black/Africa n American, 9% Hispanic/Lat ino, 38% Native American, 0% Other, 13% Pacific Islander, 0% White, 32%

Regional Center Consumers by Ethnicity

Sources: DDS consumers: FY 2014-15 Client Master File; California: U.S. Census Bureau, 2010 decennial census. Note: “Other” includes multiple and unreported ethnicity.

Who we serve

Consumer Population by Ethnicity 2011 2016 2006

38% 32% 11% 9% 7% 2% 0.3% 0.2% 35% 36% 10% 10% 6% 2% 0.4% 0.2% 33% 41% 8% 10% 6% 2% 0.4% 0.2%

Hispanic White Other Black/African American Asian Filipino Native American Polynesian

Who we serve

Source: Research Section analysis of Client Master File and RC iSeries data, for Fiscal Year 2014-15, Statewide – based per Capita $0 $5,000 $10,000 $15,000 $20,000 $25,000 White American Indian or Alaska Native Black/African American Asian Native Hawaiian or Other Pacific Islander Hispanic Other Ethnicity or Race

Services Authorization and Utilization

Budgeted Used

Hispanic/Latino Authorized Utilized

slide-5
SLIDE 5

Source: Research Section analysis of Client Master File and RC iSeries data, for Fiscal Year 2014-15, Statewide

84% 81% 83% 81% 81% 79% 77%

65% 70% 75% 80% 85% 90% 95% 100%

White American Indian

  • r Alaska Native

Black/African American Asian Native Hawaiian

  • r Other Pacific

Islander Hispanic Other Ethnicity or Race

Services Authorized and Utilization

Hispanic/Lati no

Source: Research Section analysis of Client Master File and RC iSeries data, for Fiscal Year 2014-15, Statewide

Recent Changes

  • Restoration of the Early Start Program
  • Restoration of prior service provider payment reductions
  • Rate increases for specific service types and to provide additional

compensation for direct service providers

  • Additional funding for a paid internship program and service provider

placement incentive funding for competitive integrated employment

  • Additional funding to RC to address purchase of service disparities for

the underserved population

  • Increased funding to address statewide minimum wage increases
  • Increased funding to facilitate development of community resources for

individuals transitioning from DCs and to meet challenging service needs

  • Increase funding for RC Operations
  • Reduce Caseload Ratios
  • New Positions

Recent Changes

DDS Priorities & Initiatives

  • New Legislation and Funding
  • Home and Community-Based Settings
  • New Community Service Models
  • Self-Determination Program
  • Reduce Inequity/Disparities in Our System
  • Reporting on Regional Centers
  • Developmental Center Closures / Transition Activities
  • Community Development