
SLIDE 1
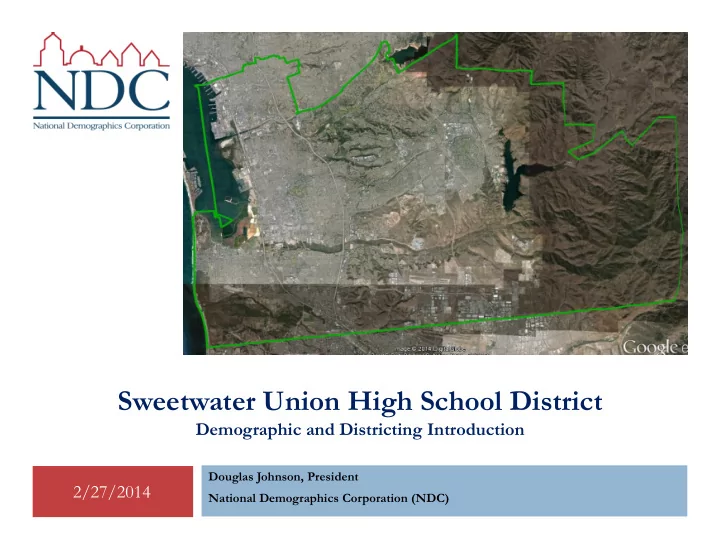
Sweetwater Union High School District
Demographic and Districting Introduction
Douglas Johnson, President National Demographics Corporation (NDC)
2/27/2014
Sweetwater Union High School District Demographic and Districting - - PowerPoint PPT Presentation
Sweetwater Union High School District Demographic and Districting Introduction Douglas Johnson, President 2/27/2014 National Demographics Corporation (NDC) age0-19 30% Age age20-60 55% age60plus 14% Immigration immigrants 33% vacant
Demographic and Districting Introduction
Douglas Johnson, President National Demographics Corporation (NDC)
2/27/2014
2/27/2014
2
age0-19 30% age20-60 55% age60plus 14% Immigration immigrants 33% vacant 9%
91% rented 46%
54% singlefamily 67% multifamily 33% english 36% spanish 47% asian-lang 9% Children at Home child-under18 40% employed 54% Commute on Public Transit 5% hhincome0-25k 21% hhincome25-50k 23% hhincome50-75k 18% hhincome75-200k 35% hhincome200k-plus 3% hs-grad 55% bachelor 15% graduatedegree 7% Work (percent of pop age 16+) Household Income Education (among those age 25+) Housing Stats Language spoken at home Age
2008 – 2012 American Community Survey Data
Total Population (2010 Census)
2/27/2014
Category Count Percentage Total
455,078
Hispanic
279,059 61%
Non-Hispanic White
83,874 18%
Non-Hispanic Black
20,541 5%
Non-Hispanic Native American
1,859 0%
Non-Hispanic Asian American
63,082 14%
Non-Hispanic Pacific Islander
2,522 1%
Non-Hispanic Other
925 0%
Non-Hispanic Other Multi-Race
3,216 1%
All multi-racial responses were tabulated using the methodology suggested by the U.S. Department of Justice and Office of Management & Budget
3
Voting Age Population (2010 Census)
2/27/2014
Category Count Percentage Total 332,037 Hispanic 189,945 57% Non-Hispanic White 71,720 22% Non-Hispanic Black 15,749 5% Non-Hispanic Native American 1,498 0% Non-Hispanic Asian American 48,680 15% Non-Hispanic Pacific Islander 1,964 1% Non-Hispanic Other 638 0% Non-Hispanic Other Multi-Race 1,843 1% All multi-racial responses were tabulated using the methodology suggested by the U.S. Department of Justice and Office of Management & Budget
4
Citizens of Voting Age Population
(2008-2012 American Community Survey)
2/27/2014
Category Count Percentage Total 267,045 Hispanic 136,631 51% Non-Hispanic White 69,789 26% Non-Hispanic Black 15,466 6% Non-Hispanic Native American 952 0% Non-Hispanic Asian American 37,113 14% Non-Hispanic Pacific Islander 1,321 0% Non-Hispanic Other 5,423 2% All multi-racial responses were tabulated using the methodology suggested by the U.S. Department of Justice and Office of Management & Budget
5
Spanish-Surname Voter Registration
(2010 General Election data from the California Statewide Database)
2/27/2014
Category Count/Estimate Total 175,758 Hispanic 50% Asian American 1% Filipino 5%
Spanish-Surname Voter Turnout
(2010 General Election data from the California Statewide Database) Category Count/Estimate Total 94,712 Hispanic 43% Asian American 1% Filipino 47%
6 We are currently updating our data to incorporate the latest Statewide Database 2012 data.
Hispanic Population
61 % of total population 57 % of voting age population 51 % of Citizen Voting Age Population 50 % of registered voters in 2010 General election 43 % of voter turnout in the 2010 General election
2/27/2014
Data Sources: 2010 Census, 2006-2010 American Community Survey (ACS), and California Statewide Database.
7
2/27/2014
(Among Population over 25)
8
2/27/2014
9
2/27/2014
10
2/27/2014
2/27/2014
1.
Review Criteria
2.
Draft Plans
3.
Public Hearing on Draft Plans
4.
Committee consideration of Draft Plans
5.
Committee adoption of a Final Plan
6.
State Board of Education Approval of Election Waiver
12
2/27/2014
Population Equality among trustee areas
Total population: not voting age population, citizens, or voters “Substantial equality” – Total deviation up to 10% is presumptively
constitutional.
10% is not, however, a “safe harbor” – deviation must be justified by “legitimate
considerations incident to the effectuation of a rational state policy.”
Federal Voting Rights Act
Compliance with Section 2: Ensure equal power to elect candidates of choice
“Protected Class” populations must have an “equal opportunity to elect the candidates of
their choice”
No “packing” or “cracking”
No racial gerrymandering
Race may not be the “predominate” factor Focus on communities and neighborhoods, not race/ethnicity
13
2/27/2014
Listed in the California Elections Code:
Topography
Geography
Cohesiveness, contiguity, integrity, & compactness of territory
Community of interests
Definition of a Community of interest
Neighborhoods, especially school attendance areas, are common communities of interest in districting.
Community should also indicate whether their preference is to be kept united (the most common view), or have a voice in multiple trustee areas?
14
2/27/2014
From Various Court Rulings:
Respecting the boundaries of political subdivisions (e.g., school attendance areas, city boundaries, precinct boundaries, etc.).
Use of whole census geography (e.g., census blocks).
Avoiding head-to-head contests between incumbents.
Anticipating future population shifts.
15
2/27/2014
Discretionary Criteria:
Consistent with the required criteria, individual districts may establish other
criteria to address unique local concerns.
Forbidden Considerations:
May not use race as “predominant” factor, unless there is a “compelling state interest.”
16
2/27/2014
Initial Steps:
Direction on any changes to criteria
NDC will draw initial draft plans (public input welcome)
Public hearing on draft plans
Public Input is highly encouraged:
Public input is important and welcomed at every stage
At any time: call, write, or email any thoughts, suggestions or draft plans
Attend public hearing
Attend Board meeting
Attend County Committee meeting
17