
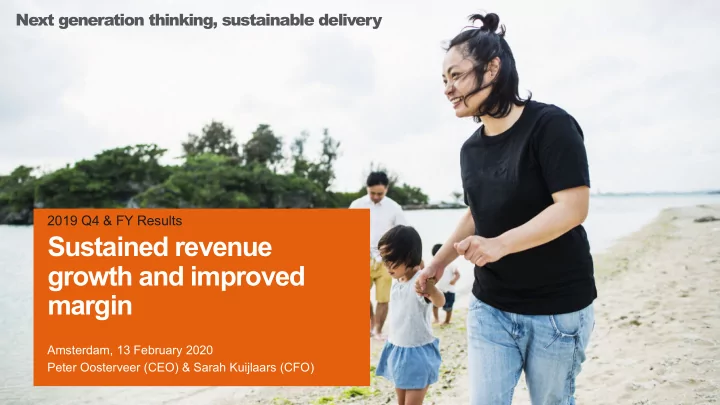
SLIDE 1
Sustained revenue growth and improved margin
Amsterdam, 13 February 2020 Peter Oosterveer (CEO) & Sarah Kuijlaars (CFO)
2019 Q4 & FY Results
Next generation thinking, sustainable delivery
Sustained revenue growth and improved margin Amsterdam, 13 - - PowerPoint PPT Presentation
Next generation thinking, sustainable delivery 2019 Q4 & FY Results Sustained revenue growth and improved margin Amsterdam, 13 February 2020 Peter Oosterveer (CEO) & Sarah Kuijlaars (CFO) FULL YEAR 2019 RESULTS Sustained revenue
Amsterdam, 13 February 2020 Peter Oosterveer (CEO) & Sarah Kuijlaars (CFO)
2019 Q4 & FY Results
Next generation thinking, sustainable delivery
Sustained revenue growth and improved margin
FULL YEAR 2019 RESULTS
2
In € millions 1) 2019 2018 Change Gross revenues 3,473 3,256 7% Net Revenues 2,577 2,440 6% Organic Growth % 3% EBITDA 235 204 15% EBITDA margin % 9.1% 8.4% Operation EBITA 2) 209 177 18% Operating EBITA margin % 8.1% 7.3% Free cash flow 97 149
Net working capital % 16.6% 15.1% Net debt 310 342 Backlog net revenues (bn) 2.0 2.0 2% Backlog organic growth 0%
Full year
On track to achieve strategic targets
FULL YEAR 2019 RESULTS
Organic Net Revenue Growth
Operating EBITA%
Free Cash Flow
1) All figures based on IAS 17 2) Excluding acquisition, restructuring and integration-related costs
3
Total Net Revenue
Improvement areas Key Markets
Continued growth on the back off mega trends and actions taken
FULL YEAR 2019 RESULTS 84% 16%
Key Markets 84% of net revenues
Improvement areas 16% of net revenues
( 8.7%)
(67)
(1.0%)
(163) Organic NR growth % Operating EBITA % DSO
Between brackets figures 2018
4
Continued strong performance in key markets
FULL YEAR 2019 RESULTS
Organic NR %
Operating EBITA
DSO
North America
containing indirect cost
voluntary employee turnover rate to 9.4% United Kingdom
and reputation supported growth and margin improvement during Brexit uncertainty
£120bn infrastructure spending Continental Europe
delivered more predictable performance
infrastructure, energy transition and climate resiliency strong drivers for further growth Australia
strategic plan and
levers created ‘Best in class’ growth, margin and cash conversion
infrastructure pipeline CallisonRTKL
transforming the business
and improving operating performance
(8.7%) (67)
Between brackets figures 2018
5
DSO
DSO
Improved results following actions identified last year
FULL YEAR 2019 RESULTS
(-3%)
DSO (265) (125) (5%) (120) (-2%)
Middle East
and limited number of countries has paid off
Asia
simplification of organizational structure created significant margin improvement and first organic growth in 4 years
and abandoned D&E services in China Latin America
‘fit for purpose’ operation
Environment and turnaround in Infrastructure
Between brackets figures 2018
6
PF AS: innovation in remediation
FULL YEAR 2019 RESULTS
revenues annually
projects at >400 client sites in 12 countries
PFAS are one
biggest emerging contaminants endangering humans & the environment
Global partnerships
7
8
Recent wins
Arcadis Gen: digitally connect our clients with their built & natural assets
FULL YEAR 2019 RESULTS
Arcadis’ digital transformation and propositions to clients
products
advanced analytics capabilities
Ensure safe and reliable mobility for 33 million passengers Improve frequency and reliability of services to accommodate London’s rapidly growing population
A 130-year heritage of sustainability-focused outcomes to clients
contributions focus around five SDGs
contribution to the 5 SDGs relevant for Arcadis
Score from 70 to 73 Celebrating 10-year collaboration Acquisition in urban planning & energy transition Peter Oosterveer member Executive Committee
FULL YEAR 2019 RESULTS
Reduced carbon footprint by 30% from our 2014 benchmark
9
10
IJMUIDEN, THE NETHERLANDS “IJMUIDEN VER”
613 607 628 647 642 660 4% 2% 2% 2% 3% 5%
45 44 47 49 53 60 7.4% 7.2% 7.5% 7.6% 8.3% 9.0%
00% 01% 02% 03% 04% 05% 06% 07% 08% 09% 10%
Sustained revenue growth and operating margin improvement
Net Revenues and organic growth 1) € millions, %
Q3’18 Q4’18 Q1’18 Q2’18 Q3’19 Q4’19
Operating EBITA (margin) 1) € millions, %
FULL YEAR 2019 RESULTS
1) All figures based on IAS 17
Q3’18 Q4’18 Q1’18 Q2’18 Q3’19 Q4’19 585 521 576 569 639 616 18.1% 15.1% 17.4% 16.2% 19.1% 16.6%
00% 05% 10% 15% 20%
89 80 86 82 95 88
Net Working Capital %
Q3’18 Q4’18 Q1’18 Q2’18 Q3’19 Q4’19
Days Sales Outstanding Days
Q3’18 Q4’18 Q1’18 Q2’18 Q3’19 Q4’19
11
In € millions 1) 2019 2018 Change EBITDA 235 204 15% Depreciation
8% EBITA 189 162 17% Amortization & impairment
EBIT 172 98 75% Net finance expense
10% Taxes on income
35% Normalized income tax rate 2) 27% 27% Expected credit loss on shareholder loans and corporate guarantees
Minority interest
168% Net income 18
Net income from operations 3) 125 88 43% EPS 4) 0.20
EPS from operations 4) 1.42 1.01 41% Dividend (proposal) per share (€) 0.56 0.47 19% Full year
Increase in Net Income from Operations and Dividend
FULL YEAR 2019 RESULTS
EBITDA growth
Net income from Operations growth
Proposed Dividend, +19% vs. LY Payout ratio of 40%
1) All figures based on IAS 17 2) Excluding Expected Credit Loss relating to ALEN and goodwill impairment (2018) 3) Corrected for non-recurring items (e.g. acquisition & restructuring costs, expected credit loss and impairment) 4) Average number of shares 2019: 88.4 million (2018: 87.1 million)
12
Oracle implementation U.S. takes more time than earlier anticipated
benefits
Cash flow held back by Oracle implementation in the U.S.
FULL YEAR 2019 RESULTS In € millions 1) 2019 2018 EBITDA 235 204 Changes in net working capital
31 Changes in other working capital 36 38 Tax paid
Net interest paid
Other 16
Cash flow from operations activities 143 214 Capital Expenditures
Free cash flow 97 149 Full year
1) All figures based on IAS 17
13
324 244 381 106 68 102 86 98 67 127 113 111
Jan-00 Jan-00 Jan-00
643 662 Not past due >120 31-120 0-30
16% or €35 million
Return to normalized working capital levels in due course
€ millions Dec-18
% of GR*
Sep-19
% of GR*
Dec-19
% of GR*
Gross receivables 643 524 662 Provisions
Provisions % 10% 11% 9% Trade receivables 582
17%
465
14%
602
16% Unbilled receivables 464
13%
690
21%
600
16%
Billing in excess of costs
Net Work in Progress 174
5%
406
12%
294
8%
Accounts Payables
Net Working Capital (%) 521 15.1% 639 19.1% 616 16.6% FULL YEAR 2019 RESULTS Dec-19 Dec-18 524 Sept-19
* Based on annualized Q4 2019 Gross Revenues
14
Ageing of gross receivables € millions
2.3 2.2 2.0 1.6 1.4
100 100 100 104 112 123
7.9% 8.5% 8.2% 8.5% 8.8% 9.5%
00% 01% 02% 03% 04% 05% 06% 07% 08% 09% 10%
98
149 8 97 416 468 342 378 310
Continued strengthening of the balance sheet
Net Debt 1) € millions
FY’17 H1’18 FY’18 H1’19 FY’19
Average net debt / EBITDA 1) Calculated using bank covenant methodology
FULL YEAR 2019 RESULTS
1) All figures based on IAS 17
Free Cash Flow 1) € millions EBITDA Margin 1) € millions, %
H1’17 H2’17 H1’18 H2’18 H1’19 H2’19 FY’17 H1’18 FY’18 H1’19 FY’19 FY’17 H1’18 FY’18 H1’19 FY’19
15
33% of net revenues 2019 2018 change Gross revenues 1,394 1,186 18% Net Revenues 860 755 14% Organic Growth % 9% Operating EBITA 70.5 54.9 28% Operating EBITA margin 8.2% 7.3% Full year 1) Fourth quarter
GEORGIA, USA
Reduce congestion & commute times, and improve safety through digital solutions
Americas: best results since 2015
FULL YEAR 2019 RESULTS 2019 2018 change Gross revenues 390 334 17% Net Revenues 219 199 10% Organic Growth % 7%
1) All figures based on IAS 17
16
44% of net revenues 2019 2018 change Gross revenues 1,390 1,392 0% Net Revenues 1,145 1,133 1% Organic Growth % 1% Operating EBITA 87.0 77.4 12% Operating EBITA margin 7.6% 6.8% Full year 1) Fourth quarter
rise (energy transition). Strong performance in the Netherlands
activities; backlog increased with 4%
margin improvement. Organic growth returned in the last quarter
Europe & Middle East: strong fourth quarter in all regions
FULL YEAR 2019 RESULTS 2019 2018 change Gross revenues 369 349 6% Net Revenues 294 267 10% Organic Growth % 7%
1) All figures based on IAS 17
GERMANY
Support construction of new GIGA factory for TESLA
17
14% of net revenues 2019 2018 change Gross revenues 388 375 3% Net Revenues 350 331 6% Organic Growth % 3% Operating EBITA 34.9 25.4 37% Operating EBITA margin 10.0% 7.7% Full year 1) Fourth quarter
Asia Pacific: step change in operating margin
FULL YEAR 2019 RESULTS 2019 2018 change Gross revenues 98 97 1% Net Revenues 91 82 11% Organic Growth % 9%
1) All figures based on IAS 17
SINGAPORE
Improve mobility: 2,000 new charging points for electric car sharing service
18
9% of net revenues 2019 2018 change Gross revenues 301 301 0% Net Revenues 222 220 1% Organic Growth %
Operating EBITA 17.0 19.4
Operating EBITA margin 7.6% 8.8% Full year 1) Fourth quarter
performance
CallisonRTKL: invest in turnaround
FULL YEAR 2019 RESULTS 2019 2018 change Gross revenues 73 81
Net Revenues 56 59
Organic Growth %
1) All figures based on IAS 17
MADRID, SPAIN
New design of 120-meter “Torre Europa”, reducing emissions by 31%
19
494 416 342 310 2.5 2.3 2.0 1.4
0,0 0,5 1,0 1,5 2,0 2,5 3,0
Net debt and Net Debt / EBITDA € millions
80 98 149 97
Free Cash Flow € millions
91 88 80 88 17.5% 16.9% 15.1% 16.6%
5,0%
DRO (days) and Net Working Capital % € millions, %
176 186 177 209 7.1% 7.6% 7.3% 8.1%
2,0%
Operating EBITA (margin) € millions, %
2016 2017 2018 2019 FULL YEAR 2019 RESULTS
1) All figures based on IAS 17
Margin improvement and balance sheet strengthening
2016 2017 2018 2019 2016 2017 2018 2019 2016 2017 2018 2019
20
ANTWERP, BELGIUM
Delivery on our strategic priorities
FULL YEAR 2019 RESULTS
Strategic priorities Proof points 2019
People & Culture
predictable project execution resulting in better financial performance
Innovation & Growth
Focus & Performance
22
On track to achieve our targets set for 2020
FULL YEAR 2019 RESULTS
23
24
IFRS 16 impact
FULL YEAR 2019 RESULTS
Accounting impact only , no net cash impact
P&L impact 2019 FY IAS 17 IFRS 16 Delta Gross revenues 3,473 3,473
2,577 2,577
235 309 74 EBITDA margin 9.1% 12% 2.9% Depreciation
EBITA 189 192 3 EBITA margin 7.3% 7.5% 0.2% Non-operating costs
Operating EBITA 209 213 4 Operating EBITA margin 8.1% 8.2% 0.1% Net finance expense
Net income 12 18 6 Net income from ops 125 120
NIfO / share 1.42 1.36 0.06 Balance sheet impact 2019 IAS 17 IFRS 16 Delta Net debt 310 601 +291 Assets: right of use assets 267 +267 Liabilities: lease liabilities 291 +291
debt according to bank covenants, hence excluding lease liabilities
from operating activities minus (dis)(in)vestments in (in)tangible assets, MINUS lease payments
2020 will therefore be fully comparable with prior years (based on IAS 17)
25