Sustainable Groundwater Management Act Update August 13, 2020 What - - PDF document

sustainable groundwater management act
SMART_READER_LITE
LIVE PREVIEW

Sustainable Groundwater Management Act Update August 13, 2020 What - - PDF document

Sustainable Groundwater Management Act Update August 13, 2020 What Do We Have to Do? Partner with other GSAs in the basin Engage with stakeholders (nasbgroundwater.org) Fill data gaps New monitoring wells Collect water


slide-1
SLIDE 1

Sustainable Groundwater Management Act Update

August 13, 2020

What Do We Have to Do?

  • Partner with other GSAs in the basin
  • Engage with stakeholders

(nasbgroundwater.org)

  • Fill data gaps
  • New monitoring wells
  • Collect water quality information
  • Collect surface water data
  • Develop tools
  • Regional database system
  • Regional groundwater model
  • Prepare a GSP (and then implement it)

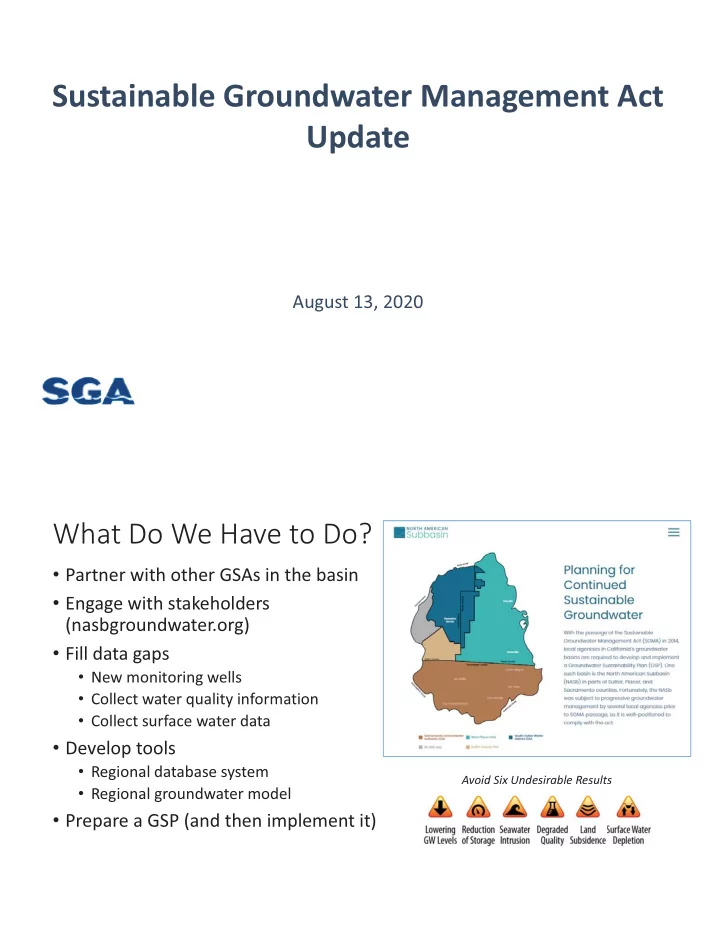
Avoid Six Undesirable Results

slide-2
SLIDE 2

GSP Components Need for Model Description of Past and Current Conditions Used for total water budget and sustainable yield estimates Projected future (50 years) – Based upon planned development, agricultural projections, and future climate conditions Used to project if there are water budget deficits in the future Sustainable Management Criteria (SMC) Assists developing SMCs for water levels, groundwater in storage, and stream depletion Description of monitoring network used to evaluate SMC Can fill in estimates of where data do not exist or identify where future data should be collected Projects and Management Actions Evaluate benefits of proposed projects and management actions

Why Model is Essential Regional CoSANA Model Update

  • 24,171 elements
  • Average element size = 37 acres
  • 86 subregions
  • 5 layers
  • Calibration period 1990-2018
  • 563 calibration wells
slide-3
SLIDE 3

Model Layering

Alluvium Laguna Mehrten Valley Springs Ione

Sacramento River Folsom Dam

A West A’ East

Key Points for Stakeholder Engagement

Review water budget and start development of SMCs – fall 2020 Draft of SMCs – winter of 2021 Public Draft

  • f GSP –

summer of 2021

slide-4
SLIDE 4

Groundwater Management Program Update

August 13, 2020

Hydrologic Conditions

  • Data from

Department of Water Resources and Water Forum

  • 2000 through 2020

average is 1.7 million acre-feet

  • 500

1,000 1,500 2,000 2,500 3,000 3,500 4,000 2000 2001 2002 2003 2004 2005 2006 2007 2008 2009 2010 2011 2012 2013 2014 2015 2016 2017 2018 2019 2020

Calculated Flow in Thousand Acre-Feet Year

Unimpaired Inflow to Folsom Reservoir

Series2

Driest Wet Average Dry

slide-5
SLIDE 5
  • 20
  • 15
  • 10
  • 5

5 10 15 20 25 30 1/1/2012 12/31/2012 12/31/2013 12/31/2014 12/31/2015 12/30/2016 12/30/2017 12/30/2018 12/30/2019 12/29/2020

MW - 6

  • 30
  • 25
  • 20
  • 15
  • 10
  • 5

5 10 15 20 25 30 1/1/2012 12/31/2012 12/31/2013 12/31/2014 12/31/2015 12/30/2016 12/30/2017 12/30/2018 12/30/2019 12/29/2020

MW - 4

slide-6
SLIDE 6
  • 40
  • 35
  • 30
  • 25
  • 20
  • 15
  • 10
  • 5

5 10 1/1/2012 12/31/2012 12/31/2013 12/31/2014 12/31/2015 12/30/2016 12/30/2017 12/30/2018 12/30/2019 12/29/2020

MW - Chuckwagon

  • 40
  • 35
  • 30
  • 25
  • 20
  • 15
  • 10
  • 5

5 10 1/1/2012 12/31/2012 12/31/2013 12/31/2014 12/31/2015 12/30/2016 12/30/2017 12/30/2018 12/30/2019 12/29/2020

MW - N28

slide-7
SLIDE 7
  • 40
  • 35
  • 30
  • 25
  • 20
  • 15
  • 10
  • 5

5 10 1/1/2012 12/31/2012 12/31/2013 12/31/2014 12/31/2015 12/30/2016 12/30/2017 12/30/2018 12/30/2019 12/29/2020

MW Lone Oak

  • 20
  • 15
  • 10
  • 5

5 10 15 20 25 30 1/1/2012 12/31/2012 12/31/2013 12/31/2014 12/31/2015 12/30/2016 12/30/2017 12/30/2018 12/30/2019 12/29/2020

MW - AB4

slide-8
SLIDE 8

2020 Groundwater Substitution Transfer

Agency Base Pumping Additional Pumping Total Pumping Carmichael WD (1) 327 127 454 Fair Oaks WD 118 186 304 City of Sacramento (2) 756 726 1,482 Sac Suburban 918 1367 2,285

Draft July Results in Acre-Feet

(1) Represents July 7 through July 31 (2) Represents July 8 through July 31

Example Transfer Monitoring Well Hydrographs

  • 40
  • 38
  • 36
  • 34
  • 32
  • 30
  • 28
  • 26
  • 24
  • 22
  • 20

4/27/2018 5/27/2018 6/27/2018 7/27/2018 8/27/2018 9/27/2018 10/27/2018 11/27/2018 12/27/2018 1/27/2019 2/27/2019 3/27/2019 4/27/2019 5/27/2019 6/27/2019 7/27/2019 8/27/2019 9/27/2019 10/27/2019 11/27/2019 12/27/2019 1/27/2020 2/27/2020 3/27/2020 4/27/2020 5/27/2020 6/27/2020 7/27/2020 8/27/2020 Groundwater Elevation (feet)

SSWD MW-5

  • 10
  • 8
  • 6
  • 4
  • 2

2 4 6 8 10 3/15/2018 4/15/2018 5/15/2018 6/15/2018 7/15/2018 8/15/2018 9/15/2018 10/15/2018 11/15/2018 12/15/2018 1/15/2019 2/15/2019 3/15/2019 4/15/2019 5/15/2019 6/15/2019 7/15/2019 8/15/2019 9/15/2019 10/15/2019 11/15/2019 12/15/2019 1/15/2020 2/15/2020 3/15/2020 4/15/2020 5/15/2020 6/15/2020 7/15/2020 8/15/2020 Groundwater Elevation (feet)

CWD Winding Way

Summer 2018 low Spring 2018 high Summer 2019 low Spring 2018 high Spring 2019 high Summer 2019 low Spring 2020 high Summer 2018 low Spring 2019 high Spring 2020 high