sustainability science Lus M. A. Bettencourt Santa Fe Institute - - PDF document

sustainability science
SMART_READER_LITE
LIVE PREVIEW

sustainability science Lus M. A. Bettencourt Santa Fe Institute - - PDF document

Mapping the evolution and structure of sustainability science Lus M. A. Bettencourt Santa Fe Institute & Los Alamos National Laboratory AAAS, Washington DC, December 1st 2010 in collaboration with Jasleen Kaur and Katy Brner Large


slide-1
SLIDE 1

Mapping the evolution and structure of

sustainability science

Luís M. A. Bettencourt Santa Fe Institute & Los Alamos National Laboratory AAAS, Washington DC, December 1st 2010

in collaboration with Jasleen Kaur and Katy Börner

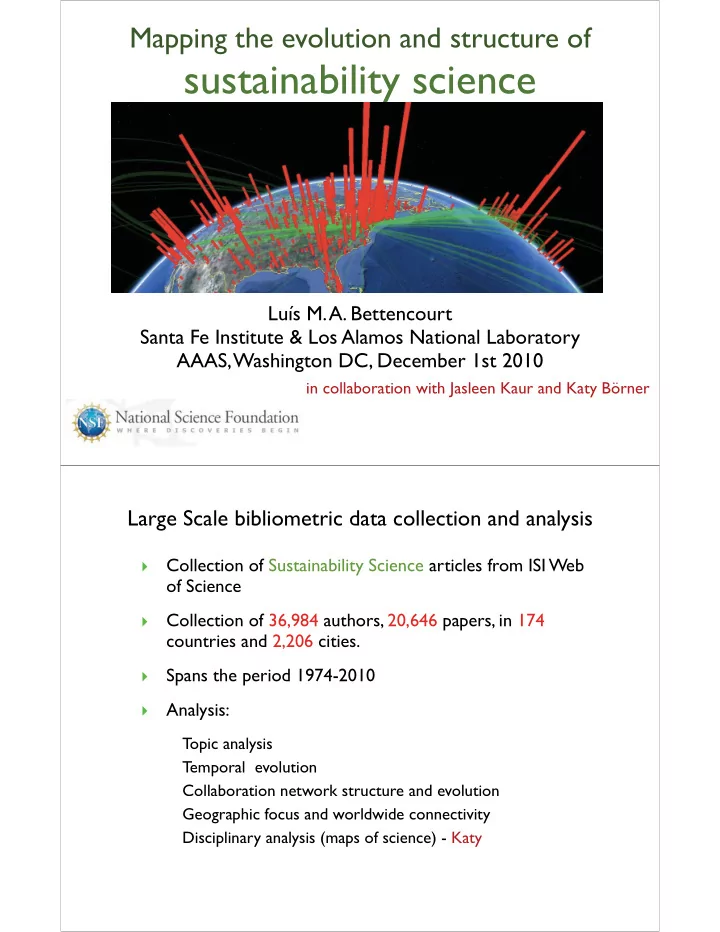
Large Scale bibliometric data collection and analysis

  • Collection of Sustainability Science articles from ISI Web
  • f Science
  • Collection of 36,984 authors, 20,646 papers, in 174

countries and 2,206 cities.

  • Spans the period 1974-2010
  • Analysis:

Topic analysis Temporal evolution Collaboration network structure and evolution Geographic focus and worldwide connectivity Disciplinary analysis (maps of science) - Katy

slide-2
SLIDE 2

first impressions

titles & keywords

word frequency from publication titles

slide-3
SLIDE 3

ISI keywords

temporal evolution

from policy to scientific field

slide-4
SLIDE 4

Ideas as ‘epidemics of knowledge’ Population models of scientific fields

competing ideas

susceptibles exposed infectious recovered

describe the dynamics of growth of the field

Bettencourt, Kaiser, Kaur 2008, 2009

slide-5
SLIDE 5

population model

idea contagion and field growth

exponential growth

Bettencourt, Kaiser, Kaur 2008, 2009

authors ~ exp t/t0

t0=12 years

critical periods and growth

increased contact rate 1989-2000

  • ur common future

UN brundtland report

PNAS sustainability science

World Conservation Strategy Agenda 21 Rio “Earth Summit”

NAS Our common journey

field unifies

slide-6
SLIDE 6

collaboration network evolution

evolution of the field’s social structure

The network structure of scientific revolutions

Kuhn 1961

“normal science” “paradigm shift” discovery invention crisis “exceptional science”

time

transition to a larger & denser graph giant component emerges graph fragmentation

slide-7
SLIDE 7

densification of network

number of collaborations increase superlinearly with authors

edges = e0 (authors)b

b=1.23 [1.20,1.25]

For every fractional increase in numbers of authors, collaboration increases by 23% per capita network densifies

percolation as field formation

a giant component of collaboration signals field formation

collaboration cluster variance

fractional size of largest cluster

field formation ~2000

Bettencourt, Kaiser, Kaur, 2009 topological transitions and field formation

slide-8
SLIDE 8

regional distribution

nations, cities and international networks

  • 1. us 9435
  • 2. england 2993
  • 3. australia 2503
  • 4. canada 2084
  • 4. germany 1370
  • 6. netherlands 1193
  • 7. france 1038
  • 8. peoples r china 988
  • 9. brazil 832
  • 10. spain 825
  • 11. italy 762
  • 12. india 699
  • 13. sweden 644
  • 14. japan 575
  • 15. switzerland 563
  • 16. scotland 490
  • 17. south africa 475
  • 18. new zealand 474
  • 19. belgium 319
  • 20. turkey 302
  • 1. us 87741
  • 2. england 19327
  • 3. australia 14949
  • 4. canada 13911
  • 5. netherlands 7601
  • 6. germany 6634
  • 7. france 6190
  • 8. sweden 5299
  • 9. peoples r china 3949
  • 10. italy 3833
  • 11. switzerland 3446
  • 12. new zealand 3263
  • 13. india 3038
  • 14. scotland 2771
  • 15. spain 2629
  • 16. brazil 2596
  • 17. south africa 2585

18, japan 2171

  • 19. kenya 2110
  • 20. austria 2096
  • 1. dutch antilles 44.0
  • 2. gambia 29.2
  • 3. zaire 21.0
  • 4. nepal 18.4
  • 5. iceland 14.4
  • 6. mauritius 14.3
  • 7. congo 13.8
  • 8. philippines 13.3
  • 9. honduras 11.7
  • 10. chile 11.3
  • 11. kenya 10.2
  • 12. martinique 10.0
  • 13. uganda 9.7
  • 14. cote d’ivoire 9.7
  • 15. us 9.3
  • 16. ecuador 9.2
  • 17. zambia 8.6
  • 18. bolivia 8.6
  • 19. solomon islands 8.5
  • 20. seychelles 8.5

rank nation papers rank nation citations rank nation cit/paper

National Rankings in Sustainability Science

developing nations show quality

slide-9
SLIDE 9

world city rankings

  • 1. washington dc 3943
  • 2. london england 3938
  • 3. boston ma 2644
  • 4. stockholm sweden 2599
  • 5. wageningen netherlands 2561
  • 6. seattle wa 2449
  • 7. madison wi 2098
  • 8. san francisco ca 2014
  • 9. ft collins co 2006
  • 10. stanford ca 1990
  • 11. new york ny 1982
  • 12. corvallis or 1882
  • 13. nairobi kenya 1726
  • 14. gainesville fl 1644
  • 15. minneapolis-st paul mn 1592
  • 16. ithaca ny 1315
  • 17. oxford england 1248
  • 18. davis ca 1243
  • 19. columbus,oh 1189
  • 20. beijing peoples r china 1151
  • 21. bloomington in 1146
  • 22. atlanta ga 1059
  • 1. washington dc 672
  • 2. london england 612
  • 3. melbourne australia 395
  • 4. nijmegen netherlands 390
  • 5. boston ma 364
  • 6. paris france 345
  • 7. vancouver bc canada 322
  • 8. brisbane australia 321
  • 9. beijing peoples r china 317
  • 10. new york ny 290
  • 11. sidney australia 284
  • 12. camberra australia 275
  • 13. toronto on canada 257
  • 14. zurich switzerland 249
  • 15. perth australia 234
  • 16. seattle wa 229
  • 17. rotterdam netherlands 206
  • 18. chapel hill-durham-raleigh nc 206
  • 19. vienna austria 205
  • 20. stockholm sweden 190
  • 21. lancaster england 184
  • 22. montpellier france 183

rank city papers rank city citations

city distribution

western hemisphere

slide-10
SLIDE 10

city distribution

eastern hemisphere

place networks

how collaborations span the globe

slide-11
SLIDE 11

place networks

how collaborations span the globe

summary

  • Sustainability Science is a field of science, engineering and

policy growing explosively worldwide (doubling ~ 8-9 years)

  • it is now (since 2000) formed as a field in that most authors

are connected via collaboration

  • it has a wide geographical distribution with a strong presence

in both developed and developing nations

  • capitals play major roles; the field is developed in western

europe (UK, Netherlands, Scandinavia, Switzerland), and

  • Australia. Developing nations produce quality publications.
  • the connectivity of several developing nations (India, Brazil,

China) remains incipient, and is primarily mediated by its largest research centers (New Delhi, São Paulo, Beijing)

Also: Worldwide patent database in energy technologies Urban scale and carbon footprint of US metropolitan areas