
SLIDE 1
Studies of the Linearity of the ATLAS EM Barrel Calorimeter
Walter Lampl
University of Arizona, Tucson
Studies of the Linearity of the ATLAS EM Barrel Calorimeter - - PowerPoint PPT Presentation
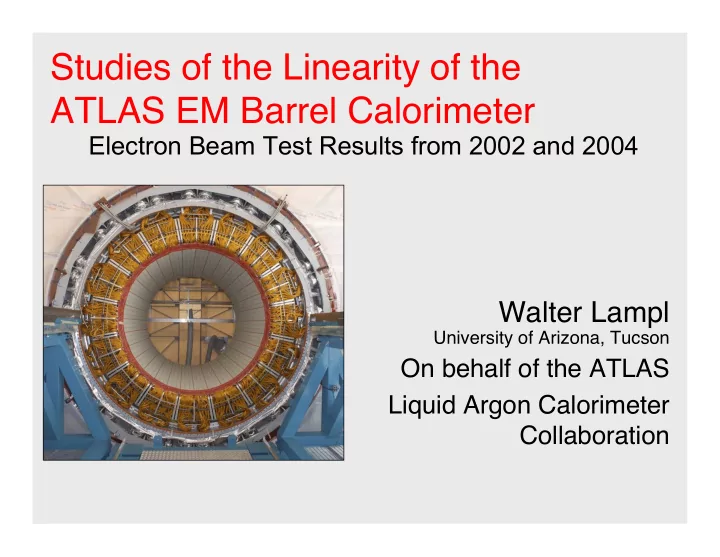
Studies of the Linearity of the ATLAS EM Barrel Calorimeter Electron Beam Test Results from 2002 and 2004 Walter Lampl University of Arizona, Tucson On behalf of the ATLAS Liquid Argon Calorimeter Collaboration Structure of the LAr
University of Arizona, Tucson
June,7th, 2006 CALOR06 - Walter Lampl Slide 2/16
(see talk by M. Aleksa for more details)
Accordion Sampling Calorimeter
Segmentation in three longitudinal
compartments
Presampler (Significant) amount of dead
Cryostat wall, solenoid, …
Accordion Calorimeter Cryostat Walls Presampler
e-
Calibration Strategy:
Use MC to understand effect of
upstream material
Validate MC with testbeam data Derive calibration constants from MC Cross-check by applying calibration
to testbeam.
Material in front of the Accordion in ATLAS
June,7th, 2006 CALOR06 - Walter Lampl Slide 3/16
(See talks by M. Delmastro and I. Nikolic for more details)
Precision Energy Scan
Exceptionally accurate
determination of beam energy
instrumentation
15 Energy-Points in the
range of 10 - 180 GeV
Impact point
η=0.687, ϕ=0.282
Energy and Material Scan
Varied upstream material
by adding 25mm Al plates
6 Energy points
Impact point
η=0.4, ϕ=0
Very low energy
Dedicated beam line
modification
1 to 9 GeV No linearity results yet
June,7th, 2006 CALOR06 - Walter Lampl Slide 4/16
Upstream Gap (PS/Strips) Accordion Leakage
Accordion Calorimeter Presampler
Impact point:
η=0.4, ϕ=0
Accordion:
24.5 X0 thick
June,7th, 2006 CALOR06 - Walter Lampl Slide 5/16
Weights optimize either resolution or linearity
Offset a accounts for energy loss by particles stopping before the presampler
Ionization energy loss (roughly energy independent)
Low-E bremsstrahlung photons that do not reach the Presampler (energy dependent)
Photo-nuclear interactions (energy dependent)
Weight b accounts for ionization energy loss by particles traversing upstream matter and (part of) the presampler.
A simple weight
is not sufficient!
Correlation plot
energy deposit vs PS signal features an
EUpstream=a+b EPS
100 GeV electrons, MC of 2004 setup
June,7th, 2006 CALOR06 - Walter Lampl Slide 6/16
Significant amount of inactive material (~0.5 X0)
Electronics boards and cables immersed in LAr Dependence on impact point
Shower already developed (about 2-3 X0 before Accordion) Best correlation between
Empirically found
100 GeV electrons MC of 2004 setup
June,7th, 2006 CALOR06 - Walter Lampl Slide 7/16
Depends on shower
particles are created and absorbed in the lead (much higher cross- section for photo-electric effect than argon)
depth and radius as such particles become more and more dominant.
Use different SF for longitudinal compartments?
Compromises resolution and linearity since shower depth
fluctuates.
June,7th, 2006 CALOR06 - Walter Lampl Slide 8/16
e-
γ γ
e+ e- Presampler Accordion
Dead Material Dead Material
Good linearity and resolution achieved Constants depend on impact point (upstream material)
Can be parameterized.
Constants are derived from a MC simulation of the
June,7th, 2006 CALOR06 - Walter Lampl Slide 9/16
Most difficult issue:
Accurate description of
upstream material
between energy-defining spectrometer and calorimeter (~0.15 X0)
gap between Presampler and Accordion
Plots shown use “equivalent
material” in the geometry.
understood, new simulation
More plots in M. Delmastro’s
talk Comparison of energy fraction in each layer for 10 GeV and 100 GeV (2002-run)
Far-material uncertainty
June,7th, 2006 CALOR06 - Walter Lampl Slide 10/16
R.M.S. of all points: 0.75% Most points within 2%
PS comparison better with new simulation Very little signal
June,7th, 2006 CALOR06 - Walter Lampl Slide 11/16
June,7th, 2006 CALOR06 - Walter Lampl Slide 12/16
All parameters rise when material is added
More energy lost upstream, later part of the shower is measured.
June,7th, 2006 CALOR06 - Walter Lampl Slide 13/16
June,7th, 2006 CALOR06 - Walter Lampl Slide 14/16
Procedure works also
Linear within the beam
energy accuracy
Work in progess…
Beam energy accuracy
~11%/√GeV
June,7th, 2006 CALOR06 - Walter Lampl Slide 15/16
CTB simulation Apply calibration constants derived for slightly different setup
Upstream material overestimated by 0.3 X0 Upstream material underestimated by 0.3 X0
Resulting error within 1% for energies at 50 GeV
Initial material estimation in ATLAS won’t be perfect ……
June,7th, 2006 CALOR06 - Walter Lampl Slide 16/16
Linearity of 0.1% achieved Submitted to NIM for publication
To be included in the analysis: