GHHI Survey Data Analysis As partners in GHHI, members of the Austin - - PDF document

ghhi survey data analysis
SMART_READER_LITE
LIVE PREVIEW

GHHI Survey Data Analysis As partners in GHHI, members of the Austin - - PDF document

OVERVIEW Austin s Green and Healthy Home Initiative (GHHI) is an interdepartment and interagency effort to provide Austinites with safe, efficient homes that support resident health. GHHI is a national program with 23 current


slide-1
SLIDE 1

1 GHHI Survey Data Analysis

Prepared by Austin Community Data Coalition August 22, 2018

OVERVIEW

  • Austin’s Green and Healthy Home Initiative (GHHI) is an

interdepartment and interagency effort to provide Austinites with safe, efficient homes that support resident

  • health. GHHI is a national program with 23 current

participating cities/municipalities.

  • As partners in GHHI, members of the Austin Home Repair

Coalition (AHRC)provide lower income Austin home

  • wners with repairs to achieve a green and healthy home.
  • As part of the program, AHRC member organizations

conduct a comprehensive home inventory. These are the surveys reported on in this presentation. This assessment is done pre-repair and thus reflects need.

OVERVIEW

  • We analyzed 306 surveys representing 292

unique addresses.

– 14 addresses were served twice, sometimes by different organizations. This may indicate

  • pportunities for additional follow up with the

current database of clients.

  • 438 unique residents served.
  • Surveys were collected 9/30/15 - 7/31/18 by

the seven member organizations in the AHRC.

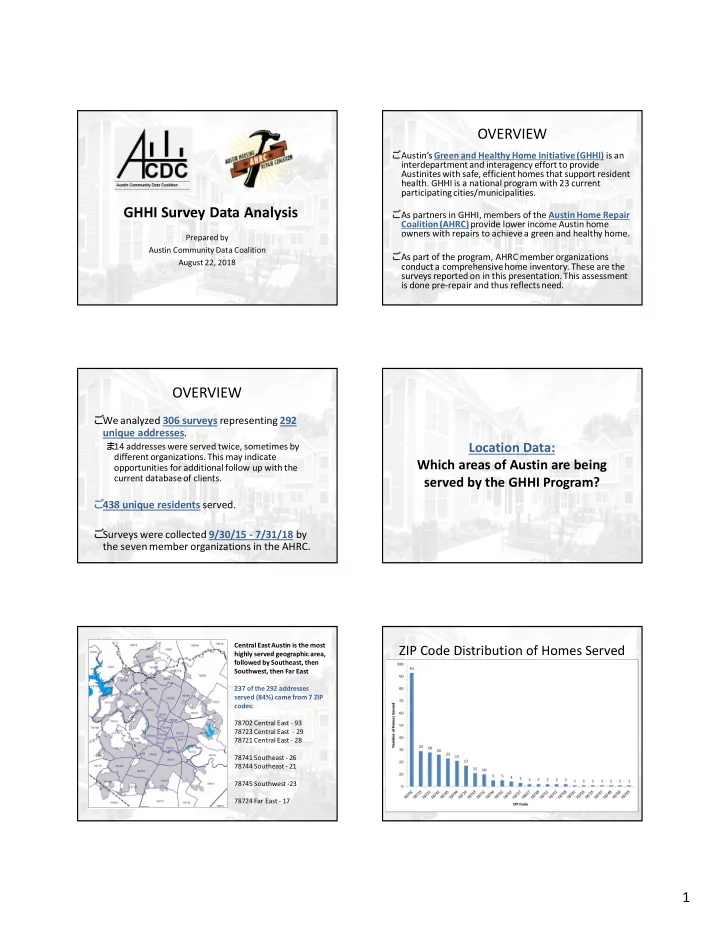
Location Data: Which areas of Austin are being served by the GHHI Program?

Central East Austin is the most highly served geographic area, followed by Southeast, then Southwest, then Far East 237 of the 292 addresses served (84%) came from 7 ZIP codes: 78702 Central East - 93 78723 Central East - 29 78721 Central East - 28 78741 Southeast - 26 78744 Southeast - 21 78745 Southwest -23 78724 Far East - 17

ZIP Code Distribution of Homes Served

slide-2
SLIDE 2

2

Council District of Homes Served

Most homes served are in Districts 1, 2, and 3.

Resident Data: Who is being served by the GGHI Program?

Average resident age is 56.9 years.

Number of Adults in Served Homes

  • 237 homes are adult
  • nly residences, with

165 of these housing single adults.

Number of Children in Served Homes

  • 23 homes are single

adult households with children.

  • 40 homes with children

house multiple adults.

slide-3
SLIDE 3

3

Some Vulnerable Demographics are Highly Represented

Children Disability Asthma Elderly

% of Total Residents

  • Average home age is 60 years (Median 58 years).
  • Average residence time is 33 years.(Median 30 years).

Respiratory Condition Burden is High

  • Surveys tallied 300 respiratory conditions.

–81 severe respiratory conditions –150 moderate respiratory conditions –69 mild respiratory conditions

  • There were 190 residents in 100 homes reporting

these respiratory conditions.

–29 of these homes has a very high respiratory illness burden, with 3 or more conditions/resident. –this is for comparison only; for multi-resident households we do not know how many residents are afflicted. *186 surveys skipped this section so these numbers are likely an underestimate of the problem.

  • Only 26 homes reported indoor or outdoor smoking.

Home Condition Scores: What are the predominant issues reported in these homes?

Electrical hazard score – combines exposed wires, uncovered outlets, other electrical hazards.

0 = no damage; 100 = maximum damage. All scores normalized by number of items included in the score.

163 homes DID NOT have GFCI outlets

0 = no damage; 100 = maximum damage. All scores normalized by number of items included in the score.

Exterior damage score – combines foundation, stairs, rails, porch, roof, gutter, spout, surfaces, chimney.

slide-4
SLIDE 4

4

Lead hazard score – combines recommended assessment, lead disclosure, presence of children or pregnant women.

0 = no damage; 100 = maximum damage. All scores normalized by number of items included in the score.

Ventilation hazard score – combines condition/presence of windows, vents, weather stripping, insulation, caulking, insulated pipes and ducts.

0 = no damage; 100 = maximum damage. All scores normalized by number of items included in the score.

Indoor pest hazard score – combines presence of roaches, bedbugs, and ants.

0 = no damage; 100 = maximum damage. All scores normalized by number of items included in the score.

Heating hazard score – combines condition/presence of heating and water heater, and usage of oven for heat.

0 = no damage; 100 = maximum damage. All scores normalized by number of items included in the score.

51 home owners report using the oven to heat the home. AC hazard score – combines condition/presence of AC and functioning windows.

0 = no damage; 100 = maximum damage. All scores normalized by number of items included in the score.

Additional Common Structural Issues

  • 120 reported issues with stairs:

–35 homes had poor condition of interior or exterior stairs. –61 lacked stair rails. –24 lacked adequate lighting on stairs.

  • 173 homes reported moisture control issues:

–96 homes have visible mold. –148 homes have water leaks. –71 have both problems. –Only 4 homes used dehumidifiers for moisture control.

slide-5
SLIDE 5

5 Less Common Structural Issues

  • 4 homes lacked electricity; 3 lacked plumbing.
  • 39 homes lacked adequate locks.
  • 11 homes reported presence of asbestos.
  • Not enough data to assess accidents/falls or

missed work days.

Summary Points

  • Overall, the GHHI has primarily served older

homeowners in Central East, Southeast, Southwest, and Far East Austin. Most residents served are over 55 and live alone.

  • The elderly and disabled populations are well

represented among residents.

  • Given the long residence time (33 years avg) of these

homeowners, coordination with other groups working

  • n property tax relief, history gathering efforts, and/or

anti-displacement programs may be beneficial.

Summary Points

  • Respiratory disease burden appears to be very high,

even given incomplete reporting. This may present additional opportunity for partnership and funding, especially considering the high number of moisture/mold issues reported in these homes.

  • Additional opportunities to reach homes with children

may involve deeper work in current ZIPs as well as expansion.

Summary Points

  • More homes experienced issues with electrical systems,

exterior structure, ventilation, pest control, stair condition, and moisture control.

  • Fewer homes reported issues with air conditioning,

heating, sanitation, locks, and asbestos.

  • There are lead-flagged homes that bear follow up.
  • High VOC homes may indicate an opportunity for
  • education. Similarly, few residents implement moisture
  • control. Both would improve indoor air quality.

The Austin Community Data Coalition

Executive Director: Amanda Masino, Ph.D Director of Operations: Alexis Taylor Data Analyst: Leon Vanstone, Ph.D. Please contact ammasino@htu.edu with questions or for more information . ACDC is a research and education nonprofit that addresses data gaps in areas of civic and community

  • significance. We want to equip policymakers and

stakeholders with clear, understandable data that helps them assess policy impacts on intended beneficiaries.