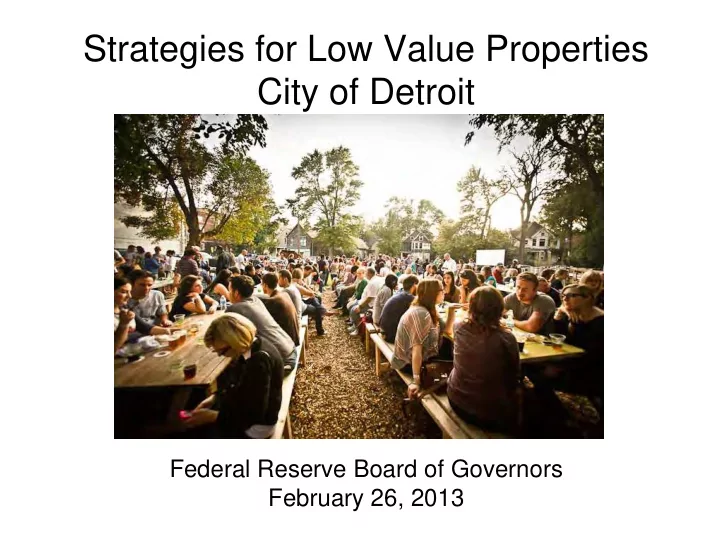

Strategies for Low Value Properties City of Detroit Federal Reserve Board of Governors February 26, 2013
City of Detroit Integrated Citywide Map (Market Value Analysis + Residential Physical Condition Analysis)
White Picket Fence Program -letters sent to adjacent property owners with application already completed -property owner just signs application & submits $200 -City mails back deed -financial institution provides funding to non-profit for gift cards -non-profit administers $200 gift card from local lumber store for fencing materials
“Detroit sells city-owned vacant lots to neighbors, cleaning up neighborhoods” Detroit Free Press December 14, 2012
Blight Removal -Since 2010 to date removed over 6,700 abandoned structures -Goal is to reach 10,000 by end of 2013 -Dangerous buildings inventory is 38,779 -Launched public/private partnership with The Blight Authority, a Michigan non-profit corporation created by Pulte family -“Reverse engineering” model operates at a high efficiency and low cost -10 block area pilot project on east side of Detroit
1 E E LOT CLEARING 2266 (2224) 2174 E E 3 2 Old Park (3465) (3465) 7 8 LOT CLEARING Burnt Church (2145) (2133) 2157 E E 4 (3435) 6 (2224) E 2126 5 (3421) E LOT CLEARING 11 10 (2285) (2281) 2229 2241 E E 2280 9 LOT CLEARING LOT CLEARING (2160) LOT CLEARING
Before & After
Detroit Works Project Short-Term Actions Demonstration Areas
Non-REO Sales by Area of Focus Median Median Sales 09 - Sales 11- Percent Percent 09-10 11-12 10 12 Non-REO Non-REO 09-10 11-12 Demo #1 $50,000 $57,525 365 244 80% 77% (east Liv)) Demo #1 $18,159 $18,077 545 528 74% 79% (west Liv)) Demo #2 $13,250 $15,000 348 384 74% 80% (mid area)) Demo #3 $12,500 $11,000 467 533 80% 84% (southwest) Downtown $82,000 $82,000 352 362 88% 92% Rest of $10,000 $10,000 17362 13891 76% 77% Detroit Total $10,500 $10, 618 19439 15942 76% 78%
DECISION MAKING FRAM EW O RK Housing F R A M E W O R K ZONE M A P V A C A N T P A R C E L S L A N D A R E A LAND A R E A P O P U L A T I O N V acancy 20% 43% 7% 4 , 9 0 5 A C R E S GREATER D O W N T O W N 15% 6% 10% 6 , 9 9 1 LO W VACAN CY SRECA A C R E S 8% SRONMKIGEDCA 18% 8% 24% 17 , 5 7 9 A C R E S 23% 1 6% 1 13,311 ACRES 28% 27% 21% 15,114 A C R E S M O D ERAT E VAC AN C Y 30% 58% 21% 15 , 2 7 1 A C R E S HIGH VAC AN C Y
Thank you! Karla Henderson, Group Executive of Planning & Facilities Office of Mayor Dave Bing, City of Detroit Hendersonk@detroitmi.gov 313-224-6624
Recommend
More recommend