
Strategic Quality Improvement
- Col. John Wheeler Middle School
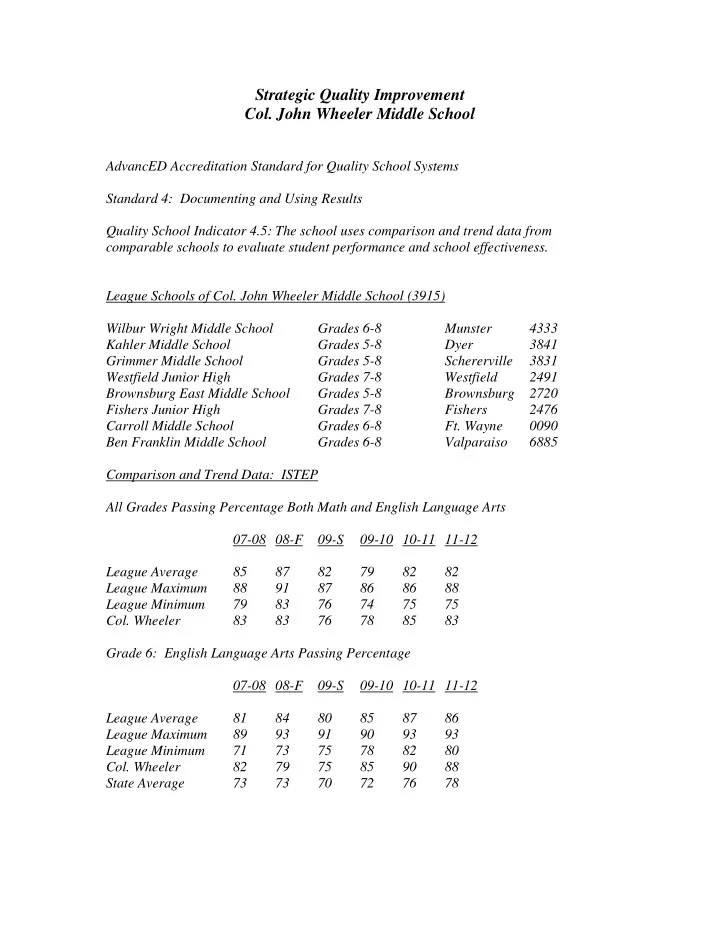
AdvancED Accreditation Standard for Quality School Systems Standard 4: Documenting and Using Results Quality School Indicator 4.5: The school uses comparison and trend data from comparable schools to evaluate student performance and school effectiveness. League Schools of Col. John Wheeler Middle School (3915) Wilbur Wright Middle School Grades 6-8 Munster 4333 Kahler Middle School Grades 5-8 Dyer 3841 Grimmer Middle School Grades 5-8 Schererville 3831 Westfield Junior High Grades 7-8 Westfield 2491 Brownsburg East Middle School Grades 5-8 Brownsburg 2720 Fishers Junior High Grades 7-8 Fishers 2476 Carroll Middle School Grades 6-8
- Ft. Wayne
0090 Ben Franklin Middle School Grades 6-8 Valparaiso 6885 Comparison and Trend Data: ISTEP All Grades Passing Percentage Both Math and English Language Arts 07-08 08-F 09-S 09-10 10-11 11-12 League Average 85 87 82 79 82 82 League Maximum 88 91 87 86 86 88 League Minimum 79 83 76 74 75 75
- Col. Wheeler
83 83 76 78 85 83 Grade 6: English Language Arts Passing Percentage 07-08 08-F 09-S 09-10 10-11 11-12 League Average 81 84 80 85 87 86 League Maximum 89 93 91 90 93 93 League Minimum 71 73 75 78 82 80
- Col. Wheeler
82 79 75 85 90 88 State Average 73 73 70 72 76 78