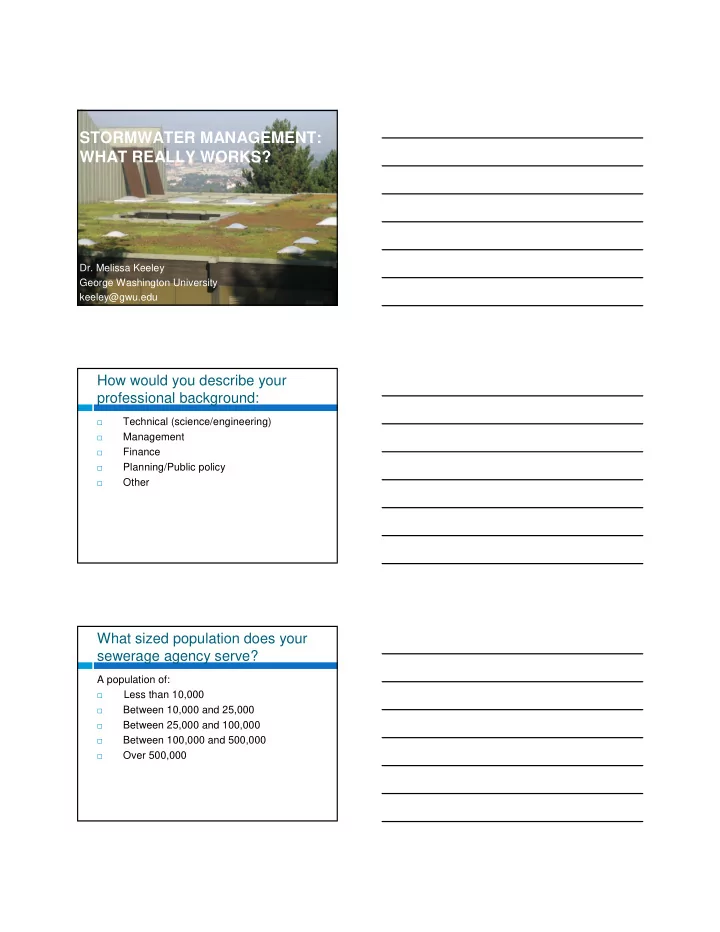

STORMWATER MANAGEMENT: WHAT REALLY WORKS? Dr. Melissa Keeley George Washington University keeley@gwu.edu How would you describe your professional background: Technical (science/engineering) � Management � Finance � Planning/Public policy � Other � What sized population does your sewerage agency serve? A population of: Less than 10,000 � Between 10,000 and 25,000 � Between 25,000 and 100,000 � Between 100,000 and 500,000 � Over 500,000 �
Scaling it up: Green Infrastructure Policy Challenges and Innovations � Green Infrastructure � Stormwater fees and green infrastructure � Individual parcel assessment � German experiences � Challenges and opportunities in the US � Engendering multi-agency support for green infrastructure � Silos and the in-between � Perception � Data Availability Green Infrastructure www.tep.uk.com/.../rightimages/er3_21.jpg http://www.mwcog.org/nationalcapitalfarms/downloads/w ma_green_infrastructure.jpg http://sitemaker.umich.edu/section9group1/files/newyork _roof_gardens.jpg Swales and rain gardens
Green Roofs Porous pavements Green Facades Characterize your agency’s current green infrastructure utilization: Not a part of our program 1. Thinking about it 2. Some pilot projects 3. Planning a SW management approach in which GI is a 4. major component Currently implementing SW management plan in which 5. GI is a major component Other 6. STORMWATER FEES AND ���������� ��������� GREEN ��������� ���������� INFRASTRUCTURE �������������������� ��������������������
Do you assess SW charges based on individual parcel or class average characteristics? We do not assess separate SW fees 1. Class averages for all parcels 2. Individual parcel characteristics for residential parcels only 3. (ERUs) Individual parcel characteristics for commercial parcels 4. only Individual parcel characteristics for all parcels 5. Other 6. Evolution of Stormwater Billing � Move toward user fees � Estimation of stormwater “burden” contribution � Often based on average runoff estimates for broad categories of property � ERU (equivalent runoff/residential units) � Also discussion about how these fees might incentivize on-site SW management Individual Parcel Assessment (IPA) � US � Primarily for industrial/commercial properties � Germany � National courts transparency ruling � IPAs of all parcels in most cities � Berlin: � Information and technology deficit � $70/parcel, $12 Million total
Remote sensing data: increasing availability, declining prices Capture land-cover conditions at a component level Quickbird Derived land- cover data satellite image Utilizing IPAs in market-based instruments � Create a “point-source” � Stormwater fees = emission charges � Optimally priced fees/subsidies � allocate control to least-cost technologies � reduce total cost of stormwater management The price-dependent effects of stormwater fees. City Stormwater fee Increasing per m 2 /year SWr fees Topeka KS $0.12- $0.29 MC Raleigh NC $0.13- $0.52 Columbus OH $0.21 Orlando FL $0.44 Optimal fee Bonn $1.81 Issaquah WA $0.67 Gie β en, FRG $0.86 (0.72 €) Köln, FRG $1.37 (1.15 €) Dresden, FRG $1.37 (1.15 €) Berlin, FRG $1.76 (1.479 €) Increasing on-site A B C SW control Bonn, FRG $1.81 (1.52 €) Rates are for 2005
Back-of-the-envelope average cost pricing for Cambridge MA City Stormwater fee per m 2 /year Topeka KS $0.12- $0.29 $11,688,657 (FY 04 SW expenditures) Raleigh NC $0.13- $0.52 5.0 x 10 6 m 2 (impervious surface) Columbus OH $0.21 Orlando FL $0.44 =$2.34/m 2 imperv.surf./year Issaquah WA $0.67 Gie β en, FRG $0.86 (0.72 €) Köln, FRG $1.37 (1.15 €) Dresden, FRG $1.37 (1.15 €) Berlin, FRG $1.76 (1.479 €) Bonn, FRG $1.81 (1.52 €) Cambridge MA $2.34 Obstacles to efficient prices � US water services pricing policies � No marginal cost pricing, no surplus, fees used for current-year services � Limited or no capital costs in fees � Public resistance to higher fees � Down side of transparency � “Paying twice”: believe that property taxes already funded infrastructure � “Rain tax”: taxing nature � Perception of fairness Emissions trading � Utility distributes emission permits � Tradable permits could increase efficiency, exploiting the heterogeneity of costs � Can requirements for functioning emissions market be met? � Check out work on this in Cincinnati, Ohio
Other Applications: Planning and Public Awareness � Site specific land use data could: � Be useful to multiple agencies � Facilitate other watershed planning/SW managment activities � Enhance resident comprehention of how land-use on their property contributes to the problem � Increased public support would benefit US utilities in two distinct ways: � enabling needed funding increases � motivating behavioral modifications or land-use changes. Applications of Robert Cialdini’s work for SW management? ������ ���������������� ��������������� ����� ������������������������ ������������������������ STORMWATER FEES AND GREEN INFRASTRUCTURE
Environmental Services Thinking Beyond SW � air quality improvement � Urban Heat Island amelioration � energy savings � wildlife habitat � aesthetic and social With which agencies have you partnered on green infrastructure projects? � Department of Planning � Department of the Environment � Department of Transportation � Department of Public Health � Parks and Recreation � Community Forestry � Regional or State agencies � NGOs � Others
Urban Bio-infiltration Prefab
Environmental Performance Summary Air Heat SW SW Feature Quality Island Quality Quantity Land Cover Turfgrass LOW MED LOW MED Unvegetated Permeable Pavement LOW MED MED MED Vegetated Permeable Pavement MED MED MED MED Green Roof MED MED LOW MED Ground Cover LOW MED HIGH MED Trees HIGH MED MED LOW Techniques Bio-Infiltration “watershed” LOW LOW MED HIGH Green Facade HIGH MED MED MED DISCLAIMER: In-progress and calculated for an area-based planning instrument, please do not use out of context. Data Availability Summary Air Heat SW SW Feature Quality Island Quality Quantity Land Cover Turfgrass FAIR FAIR POOR FAIR Unvegetated Permeable Pavement FAIR FAIR FAIR GOOD Vegetated Permeable Pavement POOR POOR FAIR FAIR Green Roof FAIR FAIR FAIR FAIR Ground Cover POOR POOR POOR POOR Trees GOOD GOOD POOR POOR Techniques Bio-Infiltration “watershed” POOR POOR FAIR GOOD Green Facade POOR POOR POOR POOR Questions?
Thank you for participating! Feel free to contact me: Dr. Melissa Keeley George Washington University keeley@gwu.edu
Recommend
More recommend