STOCHASTIC ANALYSIS OF REAL AND VIRTUAL STORAGE IN THE SMART GRID - - PowerPoint PPT Presentation

stochastic analysis of real and virtual storage in the
SMART_READER_LITE
LIVE PREVIEW

STOCHASTIC ANALYSIS OF REAL AND VIRTUAL STORAGE IN THE SMART GRID - - PowerPoint PPT Presentation

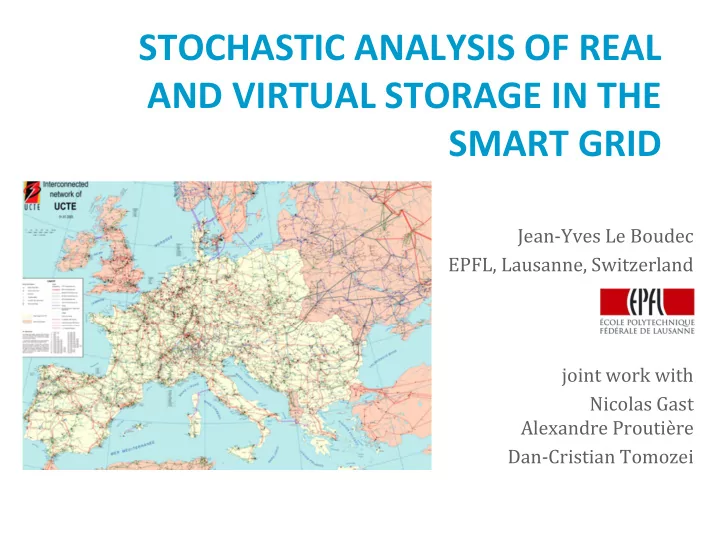
STOCHASTIC ANALYSIS OF REAL AND VIRTUAL STORAGE IN THE SMART GRID JeanYves Le Boudec EPFL, Lausanne, Switzerland joint work with Nicolas Gast Alexandre Proutire DanCristian Tomozei Outline 1. Introduction and motivation 2.


slide-1
SLIDE 1

STOCHASTIC ANALYSIS OF REAL AND VIRTUAL STORAGE IN THE SMART GRID

Jean‐Yves Le Boudec EPFL, Lausanne, Switzerland joint work with Nicolas Gast Alexandre Proutière Dan‐Cristian Tomozei

slide-2
SLIDE 2

Outline

1. Introduction and motivation 2. Managing Storage 3. Impact of Storage 4. Impact of Demand Response

4

slide-3
SLIDE 3

Wind and solar energy make the grid less predictable

5

slide-4
SLIDE 4

Storage can mitigate volatility

Batteries, Pump‐hydro Demand Response = Virtual Storage

6 Limberg III, switzerland

Switzerland (mountains)

Voltalis Bluepod switches off thermal load for 60 mn

slide-5
SLIDE 5

Questions addressed in this talk

  • 1. How to manage one piece of storage
  • 2. Impact of storage on market and prices
  • 3. Impact of demand response on market

and prices

7

slide-6
SLIDE 6

MANAGING STORAGE

2.

8

  • N. G. Gast, D.-C. Tomozei and J.-Y. Le Boudec. Optimal Generation and Storage

Scheduling in the Presence of Renewable Forecast Uncertainties, IEEE Transactions on Smart Grid, 2014.

slide-7
SLIDE 7

Storage

Stationary batteries, pump hydro Cycle efficiency

9

renewables + storage renewables load

slide-8
SLIDE 8

Operating a Grid with Storage

10

  • 1a. Forecast load

and renewable suppy

  • 1b. Schedule dispatchable

production

  • 2. Compensate

deviations from forecast by charging / discharging Δ from storage renewables load stored energy renewables load stored energy

  • Δ

Δ

slide-9
SLIDE 9

Full compensation of fluctuations by storage may not be possible due to power / energy capacity constraints

Fast ramping energy source (

  • rich) is used when storage is not

enough to compensate fluctuation Energy may be wasted when

Storage is full Unnecessary storage (cycling efficiency 100%

Control problem: compute dispatched power schedule

  • to minimize energy

waste and use of fast ramping

11

renewables load

  • Δ

fast ramping renewables load

  • spilled energy
slide-10
SLIDE 10

Example: The Fixed Reserve Policy

Set

  • to
  • ∗ where ∗is fixed

(positive or negative) Metric: Fast‐ramping energy used (x‐axis) Lost energy (y‐axis) = wind spill + storage inefficiencies

12

Efficiency 0.8 Efficiency 1 Aggregate data from UK (BMRA data archive https://www.elexonportal.co.uk/) scaled wind production to 20% (max 26GW)

slide-11
SLIDE 11

Assumption valid if prediction is best possible

  • Theorem. Assume that the error

conditioned to is distributed as . Then for any control policy: (i) where (ii) The lower bound is achieved by the Fixed Reserve when storage capacity is infinite.

A lower bound

13

slide-12
SLIDE 12

Lower bound is attained for .

14

Efficiency 0.8 Efficiency 1

slide-13
SLIDE 13

Concrete Policies

15

BGK policy [Bejan et al, 2012] = targets fixed storage level Dynamic Policy (Gast, Tomozei, L. 2014) minimizes average anticipated cost using policy iteration

Small storage Large storage

[Bejan et al, 2012] Bejan, Gibbens, Kelly, Statistical Aspects of Storage Systems Modelling in Energy Networks. 46th Annual Conference on Information Sciences and Systems, 2012, Princeton University, USA.

slide-14
SLIDE 14

What this suggests about Storage

A lower bound exists for any type of policy

Tight for large capacity (>50GWh) Open issue: bridge gap for small capacity

(BGK policy: ) Maintain storage at fixed level: not optimal

Worse for low capacity There exist better heuristics, which use error statistics

Can be used for sizing UK 2020: 50GWh and 6GW is enough for 26GW of wind

16

slide-15
SLIDE 15

IMPACT OF STORAGE ON MARKETS AND PRICES

3.

17

[Gast et al 2013] N. G. Gast, J.-Y. Le Boudec, A. Proutière and D.-C. Tomozei. Impact of Storage on the Efficiency and Prices in Real-Time Electricity Markets. e-Energy '13, Fourth international conference on Future energy systems, UC Berkeley, 2013.

slide-16
SLIDE 16

We focus on the real‐time market

Most electricity markets are organized in two stages

Real-time market

Real-time reserve

  • Actual

production Actual demand

Real-time price process P(t)

Day-ahead market

Planned

production

  • Day-ahead price process

Forecast demand

Compensate for deviations from forecast Inelastic demand satisfied using:

  • Thermal generation (ramping constraints)
  • Storage (capacity constraints)

Control

Price

Inelastic Demand Generation

Real-time market

18

slide-17
SLIDE 17

Real‐time Market exhibit highly volatile prices

Efficiency or Market manipulation?

19

slide-18
SLIDE 18

The first welfare theorem

Impact of volatility on prices in real time market is studied by Meyn and co‐authors: price volatility is expected What happens when we add storage to the picture ? Does the market work, i.e. does the invisible hand of the market control storage in the socially optimal way ?

[Cho and Meyn, 2010] I. Cho and S. Meyn Efficiency and marginal cost pricing in dynamic competitive markets with friction, Theoretical Economics, 2010

Theorem (Cho and Meyn 2010). When generation constraints (ramping capabilities) are taken into account:

  • Markets are efficient
  • Prices are never equal to marginal production costs.

20

slide-19
SLIDE 19

A Macroscopic Model of Real‐time generation and Storage

Controllable generation Ramping Constraint Randomness (forecast errors)

Supply Γ Demand

  • extracted

(or stored) power

Storage cycle efficiency (E.g. 0.8 ) Limited capacity

Day‐ahead

21 Assumption: Γ ∼ Brownian motion

Macroscopic model At each time: generation = consumption

slide-20
SLIDE 20

A Macroscopic Model of Real‐time generation and Storage

Randomness 22

Consumer’s payoff:

  • min ,

Supplier’s payoff:

  • stochastic

price process on real time market

satisfied demand Frustrated demand Price paid sell buy

Controllable generation Ramping Constraint

Supply Γ Demand

  • extracted

(or stored) power

Storage cycle efficiency (E.g. 0.8 ) Limited capacity

We consider 3 scenarios for storage ownership:

  • 1. Storage ∈ Supplier

(this slide)

  • 2. Storage ∈ Consumer
  • 3. Independent storage

(ownership does mostly not affect the results )

slide-21
SLIDE 21

Definition of a competitive equilibrium

23

Both users want to maximize their average expected payoff: Consumer: find such that ∈ argmax Supplier: find E, G, u such that and u satisfy generation constraints and , , ∈ argmax Assumption: agents are price takers does not depend on players’ actions Question: does there exists a price process such that consumer and supplier agree on the production ? (P,E,G,u) is called a dynamic competitive equilibrium

slide-22
SLIDE 22

Dynamic Competitive Equilibria

Parameters based on UK data: 1 u.e. = 360 MWh, 1 u.p .= 600 MW, = 0.6 GW2/h, 2GW/h, Cmax=Dmax= 3 u.p.

No storage Large storage, 1 Large storage, 0.8 Small storage

24

  • Theorem. Dynamic competitive equilibria exist and are

essentially independent of who is storage owner [Gast et al, 2013]

For all 3 scenarios, the price and the use of generation and storage is the same.

Prices marginal value of storage

  • Concentrate on marginal

production cost when 1

  • Oscillate for 1

Cycle efficiency

Overproduction that storage cannot store Underproduction that storage cannot satisfy Storage compensates fluctuations

slide-23
SLIDE 23

The social planner wants to find G and u to maximize total expected discounted payoff

max

,

The solution does not depend on storage owner, and depends on the relation between the reserve and the storage level (where reserve = generation – demand : :

The social planner problem

min , satisfied demand Frustrated demand Cost of generation Theorem [Gast et al 2013] The

  • ptimal control is s.t.:

if Φ) increase (t) if Φ) decrease (t)

25

slide-24
SLIDE 24

The Social Welfare Theorem [Gast et al., 2013]

Any dynamic competitive equilibrium for any of the three scenarios maximizes social welfare the same price process controls optimally both the storage AND the production i.e. the invisible hand of the market works

Overproduction that storage cannot store Underproduction that storage cannot satisfy Storage compensates fluctuations Cycle efficiency

Prices are dynamic Lagrange multipliers

26

slide-25
SLIDE 25

The Invisible Hand

  • f the Market may

not be optimal

Any dynamic competitive equilibrium for any of the three scenarios maximizes social welfare However, this assumes a given storage capacity. Is there an incentive to install storage ?

No, stand alone operators or consumers have no incentive to install the optimal storage

Expected social welfare Expected welfare of stand alone operator Can lead to market manipulation (undersize storage and generators)

27

slide-26
SLIDE 26

Scaling laws and optimal storage sizing

(steepness) being close to social welfare requires the

  • ptimal storage capacity
  • ptimal storage capacity

scales like

  • !

increase volatility and ramp‐ up capacity by = increase storage by

28

proportional to installed renewable capacity proportional to ramp-up capacity of traditional generators

slide-27
SLIDE 27

What this suggests about storage :

With a free and honest market, storage can be operated by prices However there may not be enough incentive for storage

  • perators to install the optimal storage size

perhaps preferential pricing should be directed towards storage as much as towards PV

Storage requirement scales linearly with amount of renewables

29

slide-28
SLIDE 28

IMPACT OF DEMAND‐RESPONSE ON MARKETS AND PRICES

4.

30

[Gast et al 2014] N. Gast, J.-Y. Le Boudec and D.-C. Tomozei. Impact of demand- response on the efficiency and prices in real-time electricity markets. e-Energy '14, Cambridge, United Kingdom, 2014.

slide-29
SLIDE 29

Demand Response

= distribution network

  • perator may interrupt /

modulate power virtual storage elastic loads support graceful degradation Thermal load (Voltalis), washing machines (Romande Energie«commande centralisée») e‐cars

Voltalis Bluepod switches off boilers / heating for 60 mn

31

slide-30
SLIDE 30

Issue with Demand Response: Non Observability

Widespread demand response may make load hard to predict

32

renewables load with demand response «natural» load

slide-31
SLIDE 31

Our Problem Statement

Does it really work as virtual storage ? Side effect with load prediction ? To this end we add demand response to the previous model

33

slide-32
SLIDE 32

Our Problem Statement

34 Controllable generation Ramping Constraint

Supply Γ Demand

  • extracted

(or stored) power

Storage cycle efficiency (E.g. 0.8 ) Limited capacity

We consider 2,3 or 4 actors, involving

  • 1. Demand
  • 2. Flexible Loads
  • 3. Production
  • 4. Storage

Flexible Loads

Does it really work as virtual storage ? Side effect with load prediction To analyze this we add demand response to the previous model

slide-33
SLIDE 33

Model of Flexible Loads

Population of On‐Off appliances (fridges, buildings, pools) Without demand response, appliance switches on/off based

  • n internal state (e.g. temperature) driven by a Markov chain

Demand response action may force an off/off transition but mini‐cycles are avoided Consumer game: anticipate or delay power consumption to reduce cost while avoiding undesirable states

35

slide-34
SLIDE 34

Results of this model with Demand Response

Social welfare theorem continues to hold, i.e. demand response can be controlled by price and this is socially optimal, given an installed base We numerically compute the optimum using

A mean field approximation for a homogeneous population of appliances Branching trajectory model for renewable production [Pinson et al 2009] ADMM for solution of the optimization problem We assume all actors do not know the future but know the stochastic model

36

[Pinson et al 2009] P. Pinson, H. Madsen, H. A. Nielsen, G. Papaefthymiou and B. Klöckl. “From probabilistic forecasts to statistical scenarios of short-term wind power production”. Wind energy, 12(1):51–62, 2009.

slide-35
SLIDE 35

The Benefit of demand‐response is similar to perfect storage

37

Non‐Observability Significantly Reduces Benefit of Demand‐Response

slide-36
SLIDE 36

The Invisible Hand of the Market may not be optimal

38

Demand Response stabilizes prices more than storage

slide-37
SLIDE 37

What this suggests about Demand Response :

With a free and honest market, storage and demand response can be operated by prices However there may not be enough incentive for storage

  • perators to install the optimal storage size / demand

response infrastructure Demand Response is similar to an ideal storage that would have close to perfect efficiency However it is essential to be able to estimate the state of loads subject to demand response (observability)

39

slide-38
SLIDE 38

Thank You !

More details on smartgrid.epfl.ch

40