Statistical Treatment of MELCOR Uncertainty study of CCI2 using - - PDF document

statistical treatment of melcor uncertainty study of cci2
SMART_READER_LITE
LIVE PREVIEW

Statistical Treatment of MELCOR Uncertainty study of CCI2 using - - PDF document

Transactions of the Korean Nuclear Society Virtual Spring Meeting J ul y 9-10 , 2020 Statistical Treatment of MELCOR Uncertainty study of CCI2 using DAKOTA/SNAP Yong Jin Cho * , Yoonhee Lee, Kukhee Lim, and Seong-kug Ha Korea Institute of


slide-1
SLIDE 1

Transactions of the Korean Nuclear Society Virtual Spring Meeting Jul y 9-10 , 2020

Statistical Treatment of MELCOR Uncertainty study of CCI2 using DAKOTA/SNAP

Yong Jin Cho*, Yoonhee Lee, Kukhee Lim, and Seong-kug Ha Korea Institute of Nuclear Safety 62 Gwahak-ro, Yuseong-gu, Daejeon, Korea 34142

*Corresponding author: yjincho@kins.re.kr

  • 1. Introduction

The uncertainty study has been widely used in design basis accident analysis, especially best estimate plus uncertainty in licensing. Recently, in severe accident, statistical approaches have been introduced and some applications, such as ROAAM, have been applied. Uncertainty in several severe accident phenomena plays a major role in probabilistic safety analyses involving beyond-design- basis accident (BDBA) scenarios for nuclear power plants. In this study, MELCOR2.2[1] assessment of OECD/NEA CCI2 experiment[2] was assessed using MELCOR2.2 uncertainty study and statistical evaluations was performed using correlation analysis.

  • 2. Technical Background

2.1 OECD/NEA CCI experiment[2] The experimental approach was to investigate the interaction of Pressurized Water Reactor (PWR) core melts with specially designed 2-D concrete test sections. The initial phase of the tests was conducted under dry cavity conditions. After a predetermined time interval and/or ablation depth was reached, the cavities were flooded with water to obtain data on the coolability of core melts after the interaction had progressed for some

  • time. The initial melt compositions were predominately
  • xidic. A significant metal phase was not involved, but

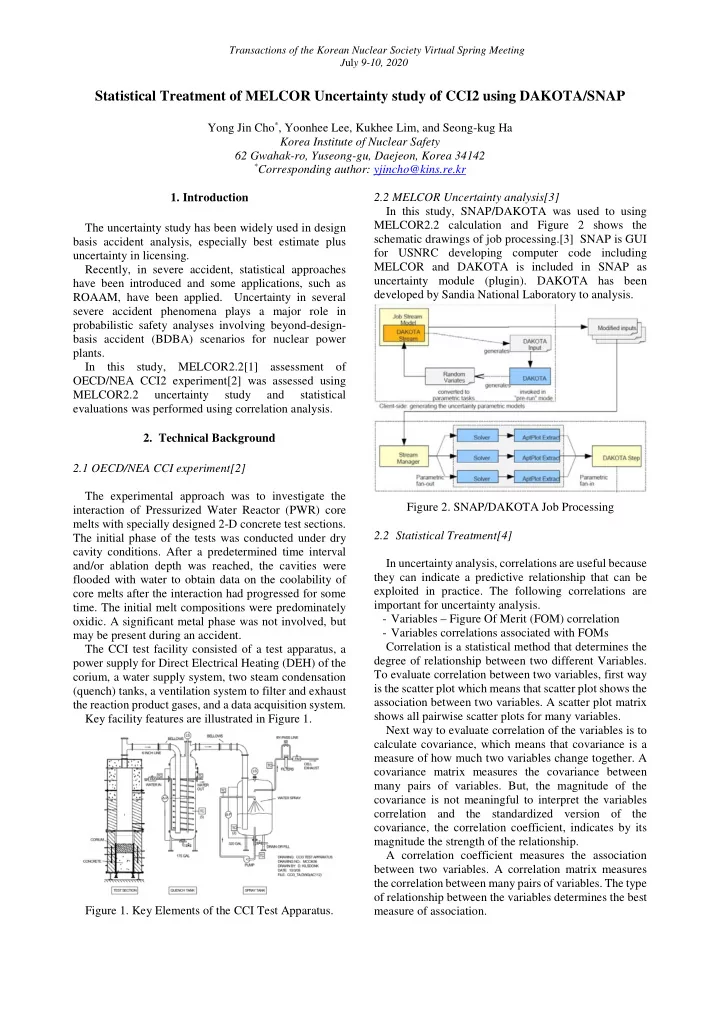
may be present during an accident. The CCI test facility consisted of a test apparatus, a power supply for Direct Electrical Heating (DEH) of the corium, a water supply system, two steam condensation (quench) tanks, a ventilation system to filter and exhaust the reaction product gases, and a data acquisition system. Key facility features are illustrated in Figure 1. Figure 1. Key Elements of the CCI Test Apparatus. 2.2 MELCOR Uncertainty analysis[3] In this study, SNAP/DAKOTA was used to using MELCOR2.2 calculation and Figure 2 shows the schematic drawings of job processing.[3] SNAP is GUI for USNRC developing computer code including MELCOR and DAKOTA is included in SNAP as uncertainty module (plugin). DAKOTA has been developed by Sandia National Laboratory to analysis. Figure 2. SNAP/DAKOTA Job Processing 2.2 Statistical Treatment[4] In uncertainty analysis, correlations are useful because they can indicate a predictive relationship that can be exploited in practice. The following correlations are important for uncertainty analysis.

  • Variables – Figure Of Merit (FOM) correlation
  • Variables correlations associated with FOMs

Correlation is a statistical method that determines the degree of relationship between two different Variables. To evaluate correlation between two variables, first way is the scatter plot which means that scatter plot shows the association between two variables. A scatter plot matrix shows all pairwise scatter plots for many variables. Next way to evaluate correlation of the variables is to calculate covariance, which means that covariance is a measure of how much two variables change together. A covariance matrix measures the covariance between many pairs of variables. But, the magnitude of the covariance is not meaningful to interpret the variables correlation and the standardized version of the covariance, the correlation coefficient, indicates by its magnitude the strength of the relationship. A correlation coefficient measures the association between two variables. A correlation matrix measures the correlation between many pairs of variables. The type

  • f relationship between the variables determines the best

measure of association.

slide-2
SLIDE 2

When the association between the variables is linear, the product-moment correlation coefficient describes the strength of the linear relationship. This generally called Pearson correlation coefficient. The correlation coefficient ranges from -1 to +1. +1 indicates a perfect positive linear relationship, and -1 indicates a perfect negative linear relationship. Zero indicates the variables are uncorrelated and there is no linear relationship. When the association between the variables is not linear, a rank correlation coefficient describes the strength of association. This is generally called Spearman correlation coefficient. This correlation coefficients range from -1 to +1. A positive rank correlation coefficient describes the extent to which as

  • ne variable increases the other variable also tends to

increase, without requiring that increase to be linear. If

  • ne variable increases, as the other tends to decrease, the

rank correlation coefficient is negative. Detailed equations are not described and calculation results will be described in this paper.

  • 3. Assessment Results and Statistical Evaluations

3.1 CCI2 experiment model using MELCOR2.2[2] The CCI test facility is very simple for MELCOR modeling but test section model using MELCOR CAV package should be carefully treated. The MELCOR model is shown in Figure 3. CCI2 test is described in Table 1. Figure 3. CCI2 MELCOR2.2 Model Table 1. CCI2 Concrete constituents and Experiment Sequences

Constituent Wt% Time(min) Major event

SiO2 21.61

0.00 Thermite Ignition start, 1880℃

CaO 25.88 Al2O3 2.49

0.10-0.38 Ablation Start

Fe2O3 1.39 MgO 11.47

1.56 Reach maximum heat input

MnO 0.03 TiO2 0.135

298.9 To break crust, use crust lance

SO3 0.505 Na2O 0.31

300.79 Water injection starts

K2O 0.55 CO2 29.71

312.6 DEH Heat input reduced

H2O, Free 3.255 H2O, Bound 1.11

423.1 Experiment terminated

Total 98.445

3.2 MELCOR2.2 Uncertainty variables[5][6] In this study, the following variables in MELCOR cavity package were selected;

  • SC2315-1, 2, 3, 4 : Melt Eruption and Water Ingress

Parameters

  • ZO : Axial coordinate of center of the ray system
  • COND.OX : Conductivity of oxidic layer
  • COND.MET : Conductivity of metallic layer
  • COND.CRUST : Conductivity of crust

In SNAP/DAKOTA, latine hypercube sampling (LHS) was used and the distribution type of the above variables assumed as triangular as shown in Table 2. Table 2. MELCOR Uncertainty Variables for Cavity Package

Variables

  • Dist. Type

Min. Mode Max. Remarks SC2315-1 Triangular 0.4 0.6 0.8 0.8* SC2315-2 Triangular 0.001 0.01 0.02 0.01* SC2315-3 Triangular 0.1 0.3 0.8 0.3* SC2315-4 Triangular 0.0 0.05 0.2 0.0* ZO Triangular 0.4 0.7 0.9 N/A COND.OX Triangular 1.0 5.0 10.0 5.0* COND.MET Triangular 1.0 5.0 10.0 5.0* COND.CRUST Triangular 1.0 1.2 5.0 1.0*

In this study, two figures of merit were used, radial ablation depth and axial ablation depth. The 99 sampling cases were adopted and calculation of 99 cases were

  • performed. Fortunately, all 99 cases were succeeded.

3.3 MELCOR2.2 Uncertainty Calculation Results In this study, comparison results of calculation and experimental result were not described and uncertainty results in view of FOMs. The experimental axial ablation depth are shown in Figure 4. As shown in figure, the experimental results are located almost center of calculation results ranges.

5000 10000 15000 20000 25000 1.00 1.05 1.10 1.15 1.20 1.25 1.30 1.35

Axial Ablation Depth (meter) Time(seconds)

CCI-2 Experiment MELCOR2.2

Figure 4. CCI2 MELCOR Uncertainty Analysis Results – Axial Ablation Depth The Figure 5 shows the comparison between the radial ablation depth results and experimental results. The

Transactions of the Korean Nuclear Society Virtual Spring Meeting July 9-10, 2020

slide-3
SLIDE 3

figure shows that uncertainty results were well distributed around the experimental results.

5000 10000 15000 20000 25000 0.25 0.30 0.35 0.40 0.45 0.50 0.55 0.60 0.65 0.70 0.75

Radial Ablation Depth (meter) Time(seconds)

CCI-2 Experiment MELCOR2.2

Figure 5. CCI2 MELCOR Uncertainty Analysis Results – Radial Ablation Depth 3.4 Statistical Treatment of MELCOR2.2 Uncertainty Calculation Results Using the above results, statistical evaluation had been performed using commercial software named ORIGIN. 1) Scattered Plot 2) Calculation of Pearson Coefficient 3) Calculation of Spearman Coefficient 4) Evaluation for Ranking of selected variables To perform the statistical evaluation, the data for input variables and FOMs are combined for each 99 cases. Using this data file, scattered plot can be made and the results shows that selected variables are well distributed. This means that DAKOTA LHS results were well

  • sampled. The scattered plot is shown in Figure 6.

Figure 6. Scatter Plot Matrix of input variable and FOM

  • f 99 cases

As next, the correlation coefficients of Pearson and Spearman were calculated and ranking were listed in Table 3. As shown in Table 3, Pearson and Spearman ranking shows differences. Ranking 1 is same but ranking 2, 3, 6, and 7 is changed. As described in previous section, Pearson coefficient assumed the linear relationship between variables and the The statistical analyses results shows that sampling soundness was validated and rough correlations between variables and FOMs. But importance ranking are not sufficiently validated and uncertainty variables independency to FOMs. Table 3. Results of Correlation Coefficients and Ranking More important evaluation issues of uncertainty analysis are following two parts. 1) Variables should have independent effects to FOMs. 2) Variables importance ranking to FOMs Through the statistical evaluation results, the above two issues, importance ranking and independency cannot be demonstrated sufficiently. To evaluate the two issues, Design Of Experiment (DOE) method[4] and multivariate analysis of variance (MANOVA)[4] should be used, that has been widely used in various area.

  • 4. Conclusions

In this study, we performed uncertainty analysis using MELCOR2.2 and SNAP/DAKOTA. After the analysis, statistical evaluation had been performed to demonstrate the soundness of the uncertainty analysis results. The statistical analyses results shows that sampling soundness was validated but importance ranking are not sufficiently validated. Also, independency of variables to FOMs could not be validated. As future works, we will use Design Of Experiment (DOE) and MANOVA method[4] to validate the MELCOR uncertainty analysis methodologies. ACKNOWLEDGEMENTS This work was supported by the Nuclear Safety Research Program through the Korea Foundation Of Nuclear Safety (KoFONS) using financial resources granted by Nuclear Safety and Security Commission (NSSC), Republic of Korea (No. 1805001). REFERENCES [1] L.L. Humphries, et al., “MELCOR Computer Code Manuals Vol 1: Primer and Users’ Guide, Version 2.2” SAND2017-0455, Sandia National Laboratories, Albuquerque, NM., 2017. [2] M. T. Farmer, et al, “OECD MCCI Project Final Report,” OECD/MCCI-2005-TR06, February 28, 2006. [3] L.L. Humphries, “MELCOR Uncertainty Analysis with SNAP & DAKOTA,” Sandia National Laboratories, Albuquerque, NM., 2015.

Variables

  • Dist. Type

Min. Mode Max. Pearson Ranking Spearman Ranking SC2315-1 Triangular 0.4 0.6 0.8 0.03674 6 0.1625 7 SC2315-2 Triangular 0.001 0.01 0.02 0.07925 3 0.15064 2 SC2315-3 Triangular 0.1 0.3 0.8 0.04358 5 0.0274 5 SC2315-4 Triangular 0.0 0.05 0.2 0.01238 8 0.01148 8 ZO Triangular 0.4 0.7 0.9 0.08507 2 0.12128 3 COND.OX Triangular 1.0 5.0 10.0 0.01674 7 0.02424 6 COND.MET Triangular 1.0 5.0 10.0 0.31707 1 0.31645 1 COND.CRUST Triangular 1.0 1.2 5.0 0.06315 4 0.04237 4

Transactions of the Korean Nuclear Society Virtual Spring Meeting July 9-10, 2020

slide-4
SLIDE 4

[4] Jim Morrison, “Statistics for Engineers: An Introduction,” June 2009 [5] Randall O. Gauntt, “An Uncertainty Analysis of the Hydrogen Source Term for a Station Blackout Accident in Sequoyah Using MELCOR 1.8.5,” Sandia National Laboratories, SAND2014-2210, March 2014. [6] Jeff Cardoni and Donald Kalinich, “Fukushima Daiichi Unit 1 Uncertainty Analysis - Preliminary Selection of Uncertain Parameters and Analysis Methodology,” Sandia National Laboratories, SAND2014-1170, 2014

Transactions of the Korean Nuclear Society Virtual Spring Meeting July 9-10, 2020